Every time a snowfall is predicted, local and national media outlets will use various computer models to generate their accumulation forecasts. All winter long, we’ve been tracking these forecasts with the goal of determining which media network is the most reliable in predicting snowfall. Our commentary, in Forecast Analysis posts like this one, will describe the map’s successes and failures in addition to assigning a 0-10 Accuracy Score. We will average each agency’s Accuracy Score throughout the winter and keep an updated rankings list at the bottom of each Forecast Analysis post.
It is important to note before we get into the post that this analysis is for Western Pennsylvania. Many of these maps also have predictions for many other parts of the Mid Atlantic and Northeast, but know our discussion is only referring to the areas around Pittsburgh.
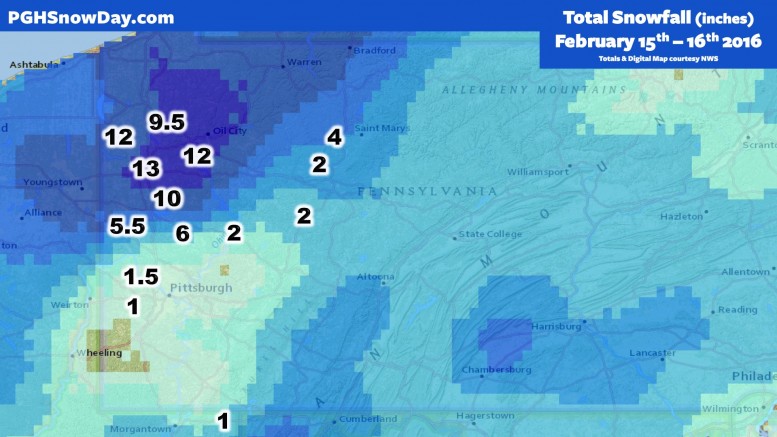
Our analysis will use official snowfall totals from the National Weather Service’s Pittsburgh Office, tweeted publicly at @NWSPittsburgh. This post would not be possible without the hard work and dedication of the NWS Pittsburgh office, which worked through the night to compile hundreds of snowfall reports. All currently available totals have been placed on the following map, with the background courtesy of the NWS’ Enhanced Data Display. NWS Pittsburgh Official Total: 1.5″
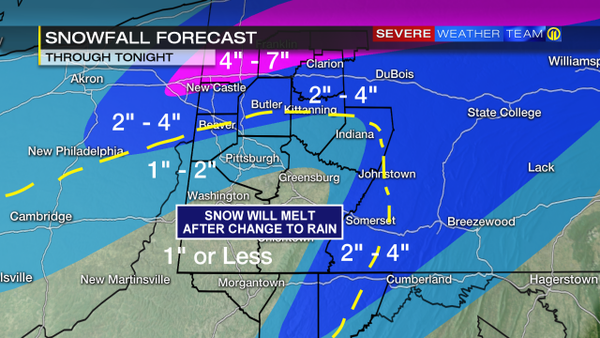
WPXI nailed areas from Pittsburgh south and east, but failed miserably north of the city. Cranberry, for instance, which recorded around 6″ of snow, is under the 1-2″ range on this map. New Castle also serves as an example of Channel 11’s vast underestimation, as it recorded 13″ of snow when it was predicted to see 7″ or less. All in all, the map had most boundaries in the right spot, but failed in labeling the zones accurately. Also, they believed snow south of the dashed yellow line would fall on the front end then wash away with rain, when in actuality the opposite happened. Accuracy Score: 2
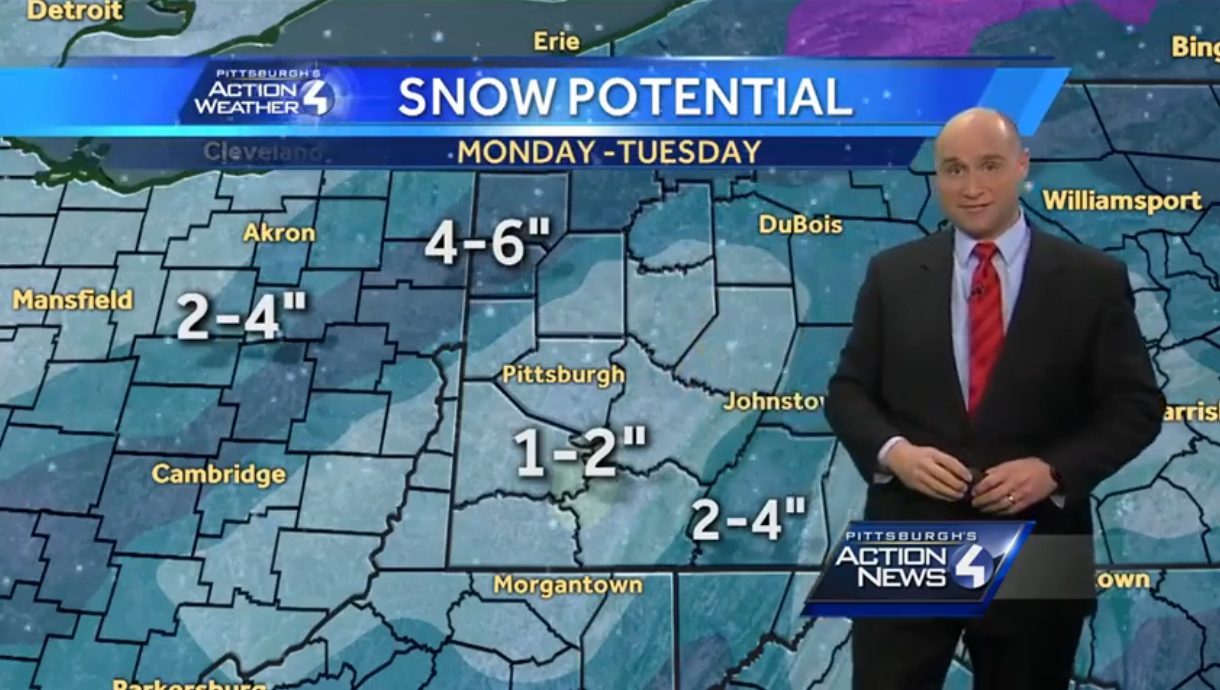
WTAE also vastly underestimated this storm. A 4-6″ prediction for New Castle was smashed by over a foot of the fluffy stuff. WTAE also undershot northern Allegheny County, which saw 6 or more inches of accumulation despite a 1-2″ prediction. Other than that, just like WPXI, the totals from Pittsburgh on south were almost perfect. Accuracy Score: 2
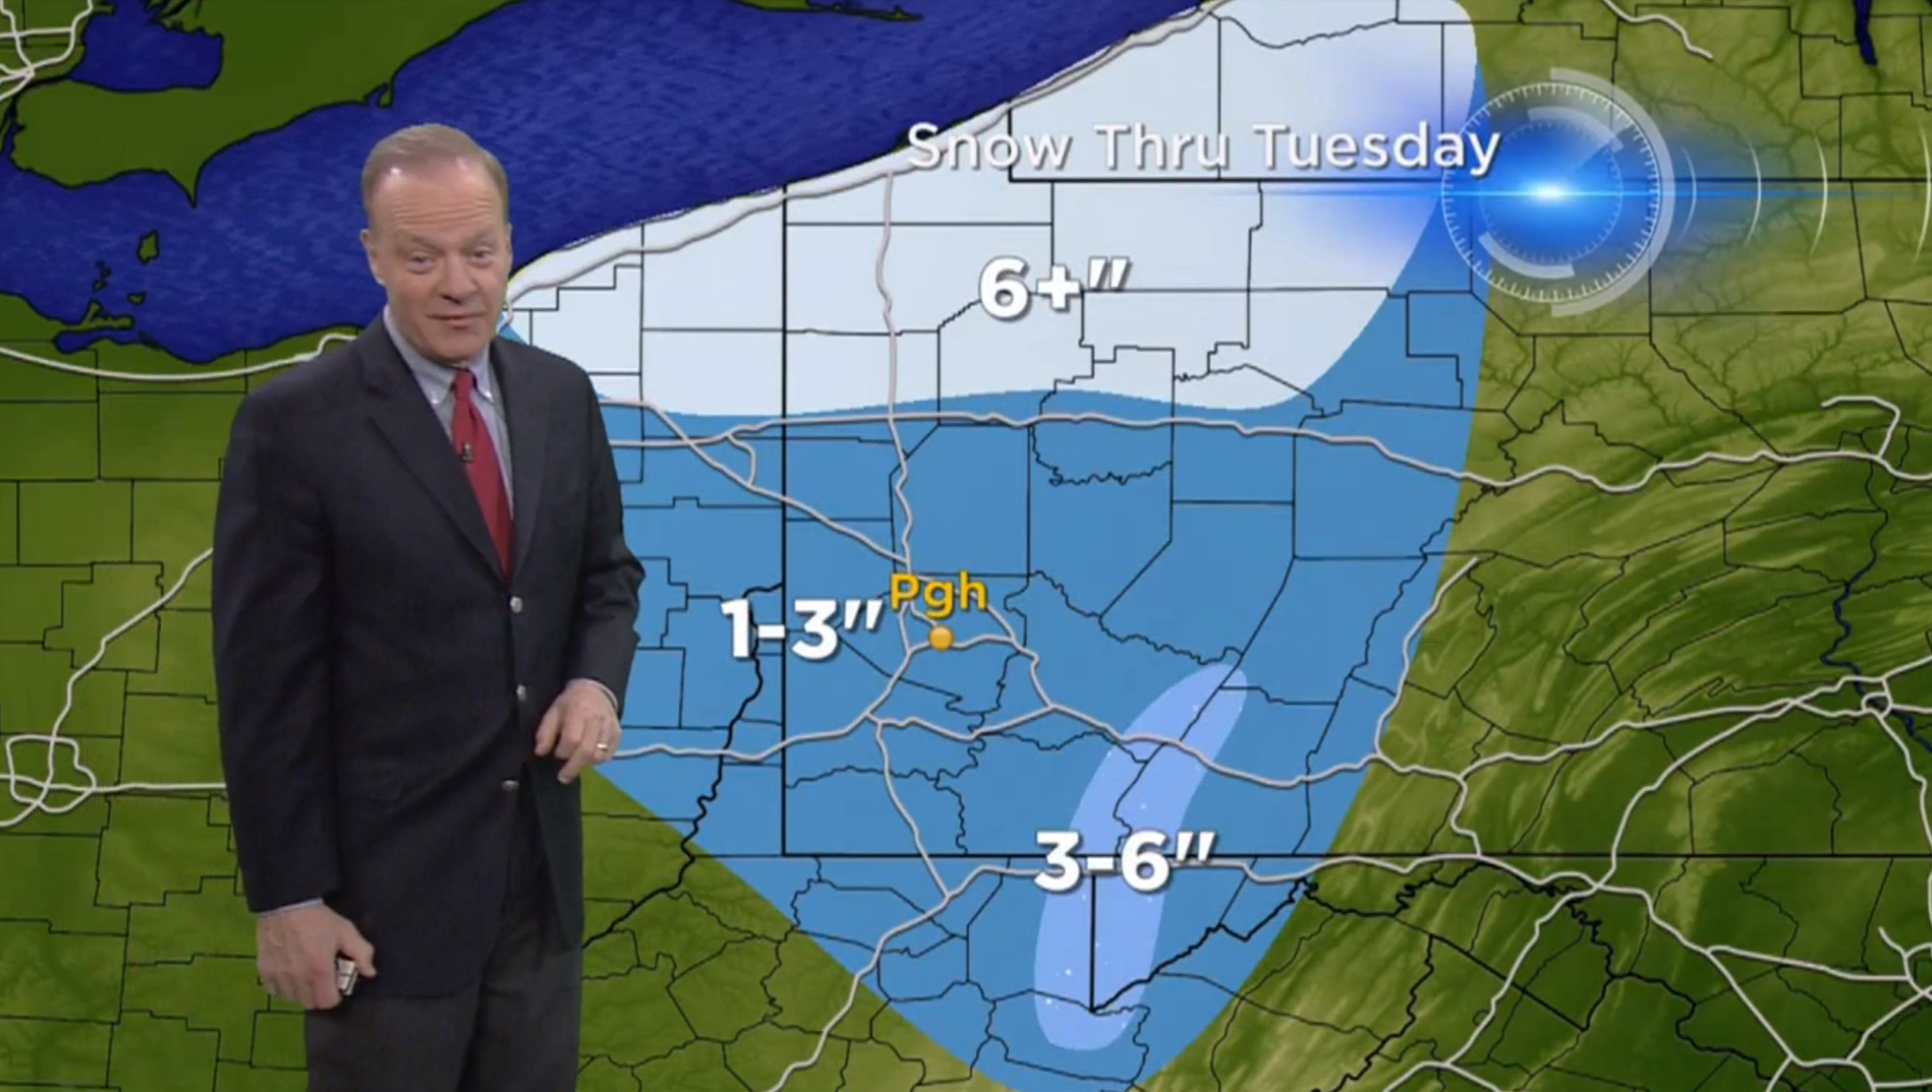
KDKA kept their map vague, and it worked out alright for them. They kept the high accumulation numbers in the ridges confined only to a small area of the highest elevations, and that is well reflected on the analysis map. They correctly predicted the 1.5″ in the city, but like their other local counterparts, dropped the ball in northern Allegheny County. Their 6+” range, which was fairly labeled, was way too far north — in fact, reports of 10 or more inches were forecast to see 3 or less on this map. Accuracy Score: 2
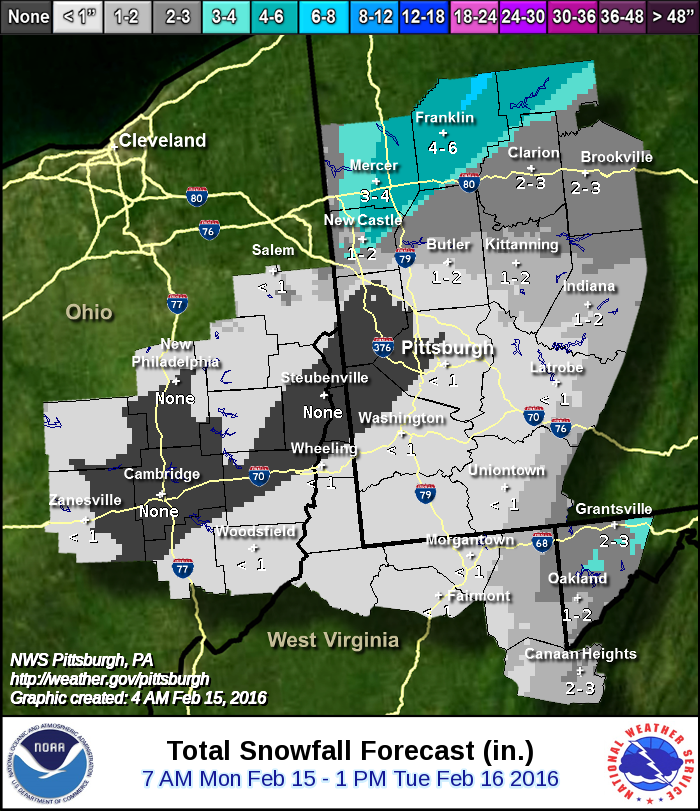
The Pittsburgh Office of the National Weather Service published one of the more surprising maps for this storm, and the speculation was well deserved. Let’s jump right to New Castle, which was forecast to see an inch or two by the NWS PBZ, only to get over a foot. That is really, really bad. In addition, the NWS called for no snow in the eastern hook of Allegheny County, when in actuality that saw higher totals than areas further east towards the city. Calling for nothing and getting over an inch is also really, really bad. Although Clarion and Brookville were accurately forecast on this map, the glaring issues overshadow these few successes. Accuracy Score: 0
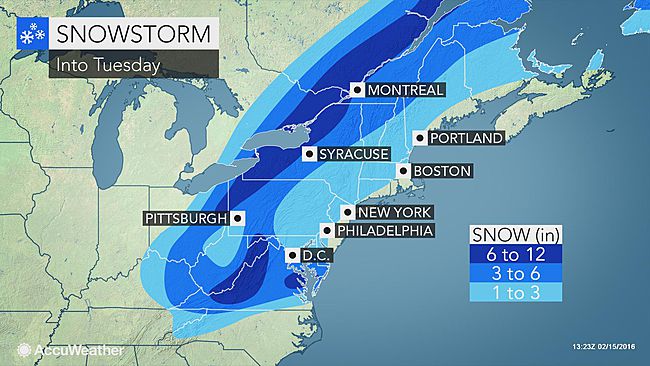
AccuWeather was a big believer in the “snow hole,” an area of low accumulation in Western PA. Their gamble paid off, and they were right to keep the 1-3″ and 3-6″ boundary just north of the city. That range means an area like Cranberry was correctly forecast, and areas north (such as New Castle’s 10+ inches) were also correctly placed in a 6-12″ zone. Pittsburgh’s 1.5″ falls within the 1-3″ prediction. In the end, this map leaves me wondering why KDKA – a customer of AccuWeather’s maps – doesn’t just let the national behemoth do the dirty work for them. Accuracy Score: 10
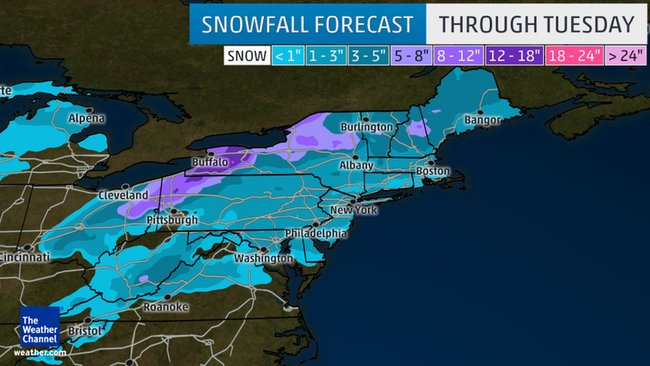
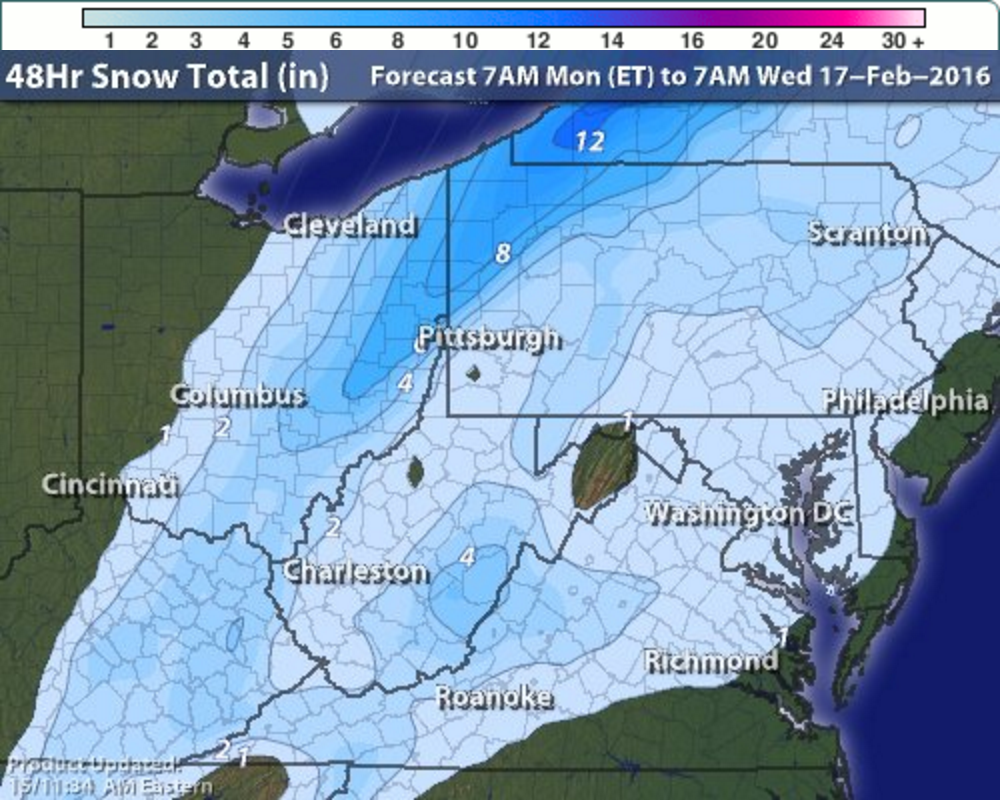
The Weather Channel drastically changed their map from when the first published it last Thursday, and they too bought into the warming trend just a little too much. Pittsburgh, and areas just south, were predicted to stay all rain by TWC, but in actuality they saw around an inch. However, aside from that small mistake, the rest of this looks spot on. They correctly brought the tight C-1″ and 1-3″ gradients just west of the city to include the airport, which got 1.5″. In addition, northern areas like Grove City and New Castle accurately fell in 5-8 and 8-12 inch zones. Accuracy Score: 9
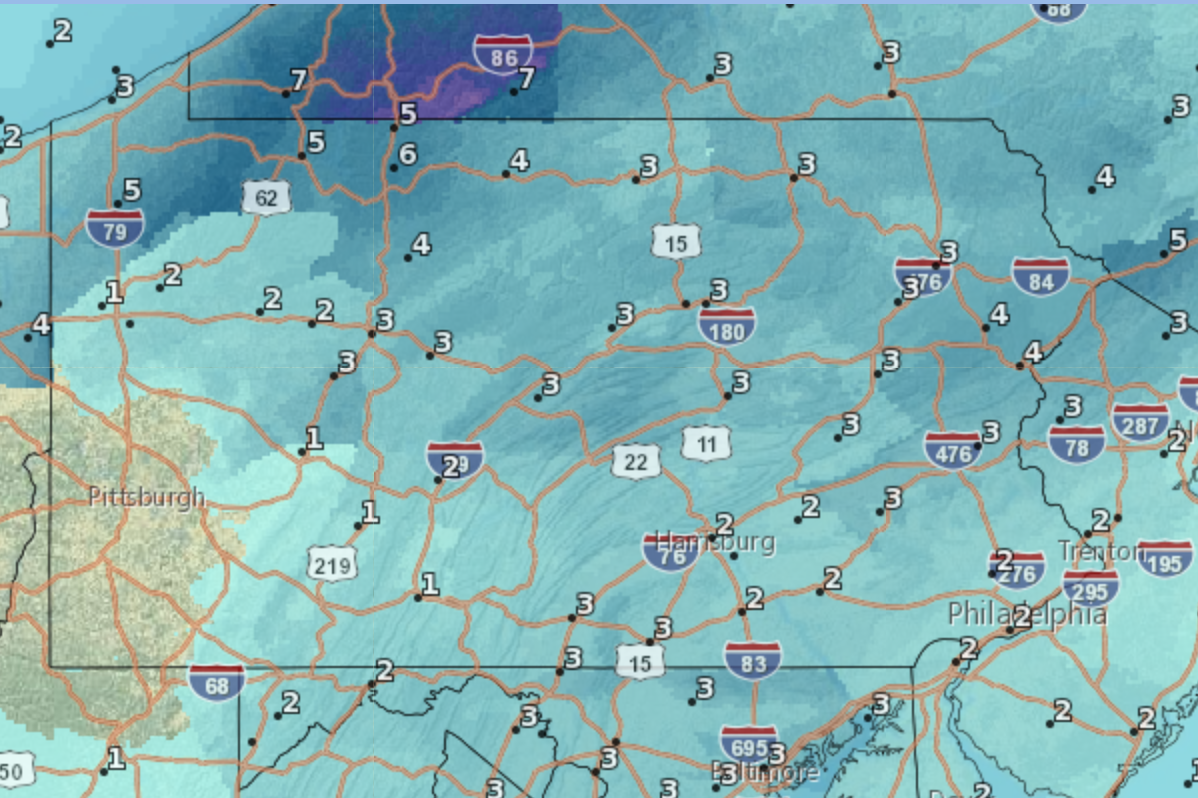
The NWS Digital model has had troubles with several storms this winter, and this one was no exception. Allegheny County was forecast to stay completely snow-less on this map, which is off from the over an inch official measurement in moon. In addition, a 5″ label is the max on this map – a staggering 8″ off from the 13 incher in New Castle. Accuracy Score: 0
Intellicast has historically been one of the most reliable weather forecasts we track, and their map for this system looked believable. After the last flake fell, it turned out to be almost right in line placement, but like many others, undershot totals. Western Allegheny County correctly fell in a 1-2″ zone, but northern cities like Cranberry were way off with a 1″ zone placement. New Castle fell between 6 and 8 inches, which is among the highest predictions, but still too low. This map had the right shapes and many right numbers, but a few big mistakes north of the city. Accuracy Score: 6
Here’s a look at the updated grades:
Be the first to comment on "Forecast Analysis: Feb. 15-16 Winter Storm"