Before we begin this roundup of forecast maps for this weekend’s snowfall, it needs to be reiterated that this storm is quite tricky. Weather models have been flipping and flopping all week long, and less than 96 hours ago, there was a certain level of confidence that Pittsburgh would see nearly a foot of snow. As the week progressed, those models trended south, thus leading to much lower snow totals in Allegheny County and surrounding areas. This forecast is among the most difficult in memory, and certainly the most difficult since we began tracking predictions here on PGH Snow Day. With that said, it will be very interesting to see how such a complex storm actually performs, and to see which forecasts were the most accurate. After the last flake has fallen Saturday evening, we will post an article inspecting who had the most (and least) accurate snowfall forecast in our Forecast Analysis. If you’re looking for a particular forecast to trust, WPXI has done the best job so far this winter, with one perfect 10/10 score and an average Accuracy Score of 6.
Note: All of these maps were the most recent made available at 12:00 noon on Friday, January 22nd.
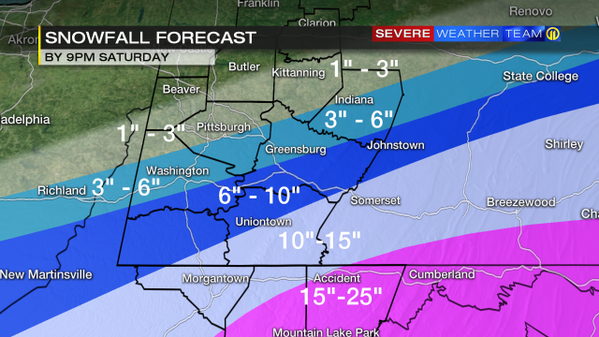
WPXI: The team at Channel 11 has done a tremendous job of warning everyone in their forecast area. They have made it clear that there is a high level of uncertainty with this storm, and thus there have slight changes to their snow map over time. Rather than g with paper thin accumulation bands, WPXI has made wider ranges to correspond with wider bands. They have been the most accurate in predicting snowfall so far this winter, and we are excited to see how they do with this very complex forecast.
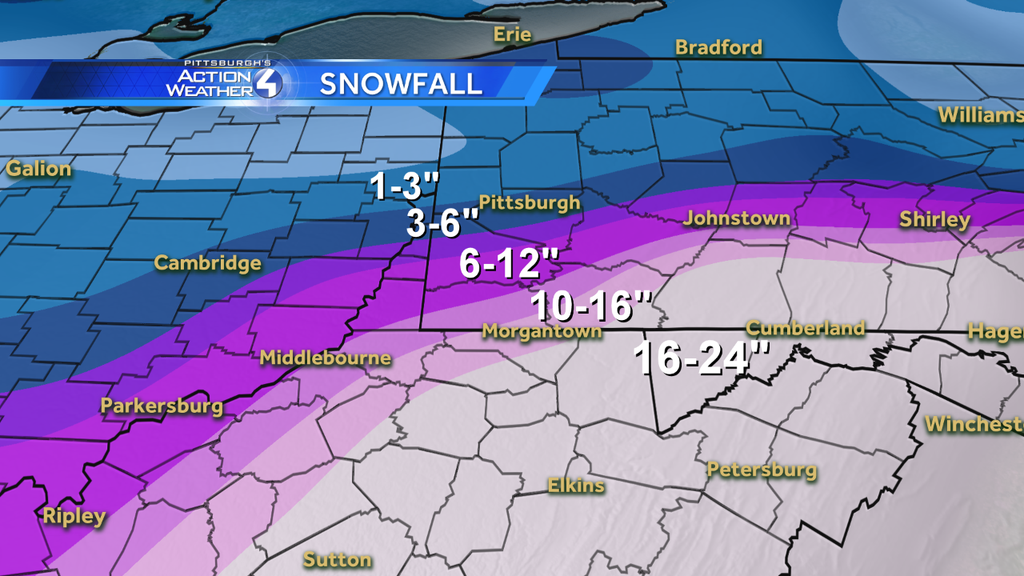
WTAE: Pittsburgh’s Action Weather elected for the thin bands, but the wide label ranges. Immediately comparing this to WPXI, WTAE has pushed the 3-6″ range further north to the tip of Allegheny County, in addition to adding what we can assume is a 4-6″ range on the bottom half of the county.
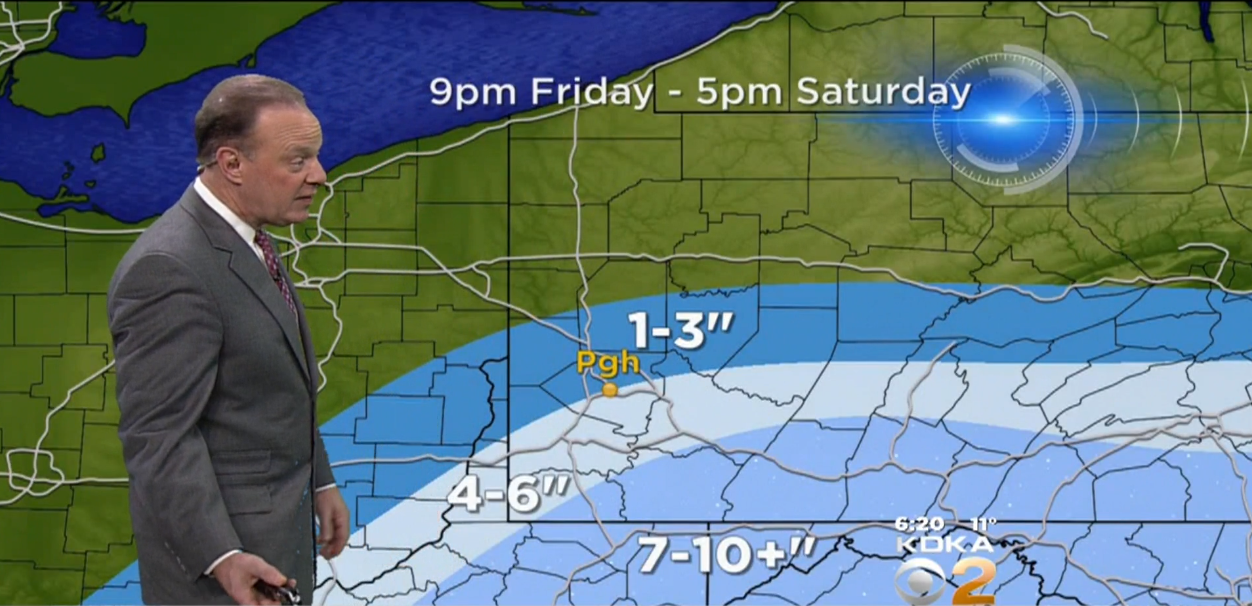
KDKA: The team of Jon Burnett and Jeff Verszyla have kept the lines on their snow map unchanged since they first made one on Wednesday. One difference that should be pointed out is the change of a 3-5″ label in the middle band to 4-6″. This map has just three wide bands compared to many thin ones, which may prove to be the best approach to a storm that is drastically different over just a 25 mile range.
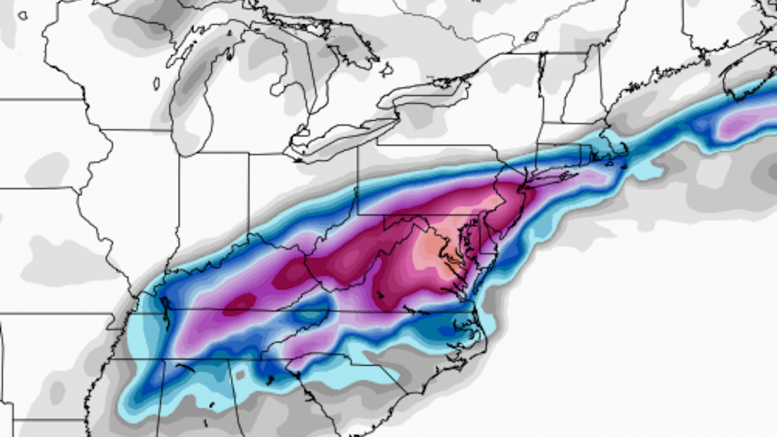
Intellicast: In the past, Intellicast has published one of our favorite snow maps to look at. Unfortunately, in the last storm their map was almost entirely incorrect, leading to an accuracy score of just 2/10. Their map for this weekend demonstrates just how ridiculously thin the accumulation gradient is. This is a remarkable cutoff that has made forecasting accumulations for specific locations so difficult. All in all, this map is in line with the average shape of all the others, but there is definitely a northern push. The 4″ line is well north of the city, and there is actually an 8-12″ range in the bottom half of the county. We’ll see if this northern gamble pays off.
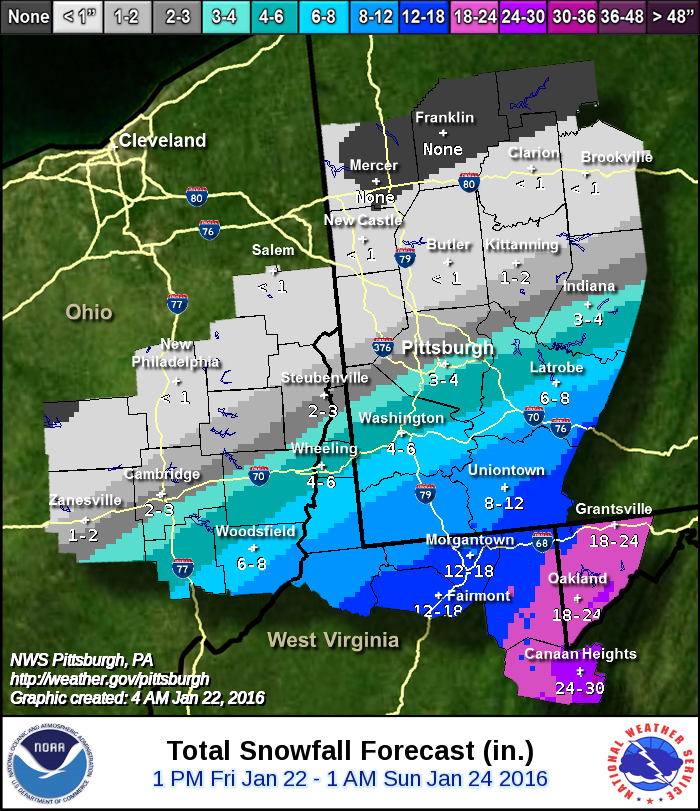
NWS Pittsburgh: One of the hardest jobs of everyone’s for this storm is the development of snow maps by the NWS field offices. The Pittsburgh office of the National Weather Service has done a great job on social media of keeping everyone updated, even though their snow forecast has not changed much. They first published their map early Thursday morning, and it has seen only minimal updates since. Like many of the other media outlets, the NWS is keeping 4-6″ as the broadest range in Allegheny County. However, unlike many of the others, the NWS believes the cutoff will be even sharper than many predict. From tip to tip, this map goes from less than 1″ all the way to 6-8″. In total, there are six different snow ranges just in Allegheny County. Evaluating this one tomorrow night will be interesting because it is so precise and so reliant on the storm not shifting north.

NWS Digital: Last snowfall, this model was disastrously wrong, but this time it seems to be better in line with everyone else. Like the NWS Pittsburgh map, this digital model has extremely sharp cutoffs on the northern edge, and it also is leaning towards a general 4-6″ from Pittsburgh to the southern tip of Allegheny County.
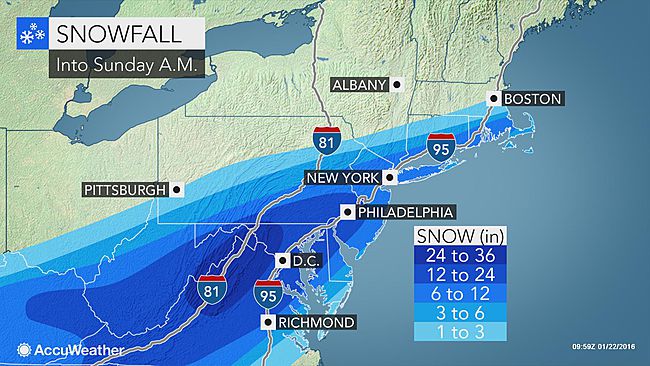
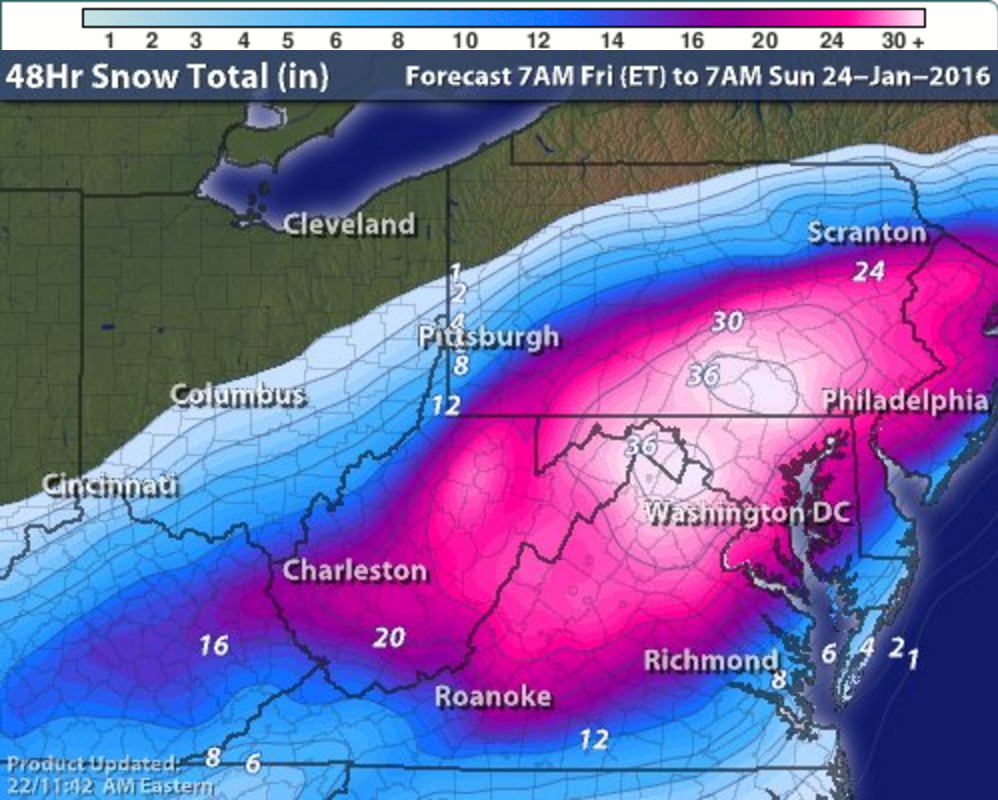
AccuWeather: The digital weather giant AccuWeather was among the first to publish an accumulation map for this storm, and although numerous changes have been made to it in the high snowfall areas, the ranges in western Pennsylvania have not changed. If anything, Accueather has moved their 1-3″ conservative range further south, and a you can see they’ve drawn the line right through the Pittsburgh dot. They are the only map in this roundup that includes a 50/50 shot for absolutely no snow in Allegheny County, as far south as the city.
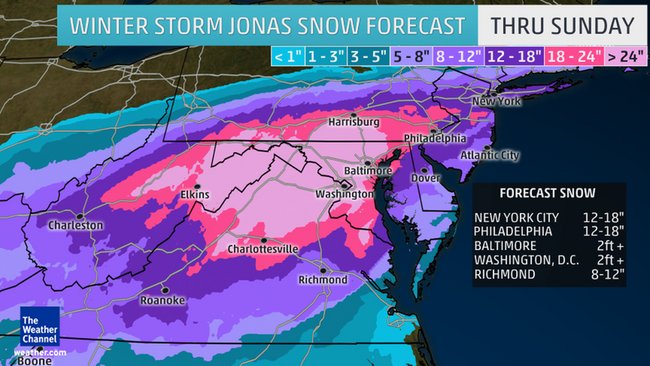
The Weather Channel: The “Weather Giant” was the first to issue a snow map for the storm they’ve named Jonas, and it has seen its fair share of changes. For two entire days, TWC excluded Pittsburgh and areas north from getting snow entirely, but in the past 48 hours has come back north. The city now sits in a thin 3-5″ band, with southern Allegheny County predicted to get 5-8″. Like the NWS, The Weather Channel expects and extremely sharp cutoff of accumulating snow, meaning 5″ in Pittsburgh could mean 0″ in Cranberry.
As we said earlier, if you’re looking for one particular map to trust on this page, WPXI has been the best so far this winter. We’ll be back with our much anticipated analysis of these maps tomorrow night. Stay safe out there Pittsburgh! Note: WTAE and WPXI did not issue their FutureCast Snow Models for this storm, and we can understand why.
Leave a comment