Welcome to our first forecast analysis of the winter season. Snowfall projections are ranging anywhere from a dusting to 3 inches, thus there are some discrepancies in the forecasts. Each predicted measurable snow event will have a roundup article like this one posted so that you can view each network’s predictions for the storm. After the last flake has fallen, we will post an analysis article inspecting who had the most (and least) accurate snowfall forecast.

WPXI: Severe Weather Team 11 is following the general shape of the accumulation map for this storm. Their coating to 1″ area is larger and further north than some networks, but ultimately this forecast is in line with many of the computer models.
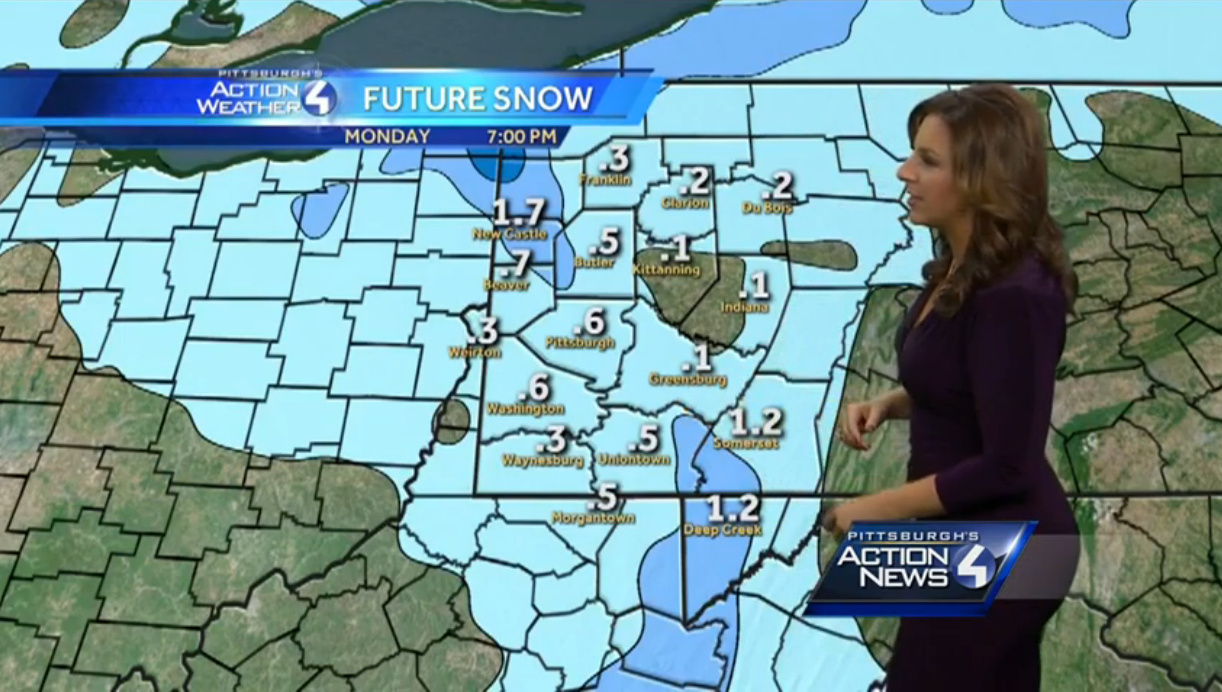
WTAE: Pittsburgh’s Action Weather has two methods of making accumulation forecasts. This one, based on their futurecast model, runs the length of the storm while giving “future snow” totals. In past years, this has been a highly accurate model and its predictions here look reasonable. It has very few areas with greater than 1″ of accumulation, which differs some other maps, but the location of these areas coincides with the general forecast.
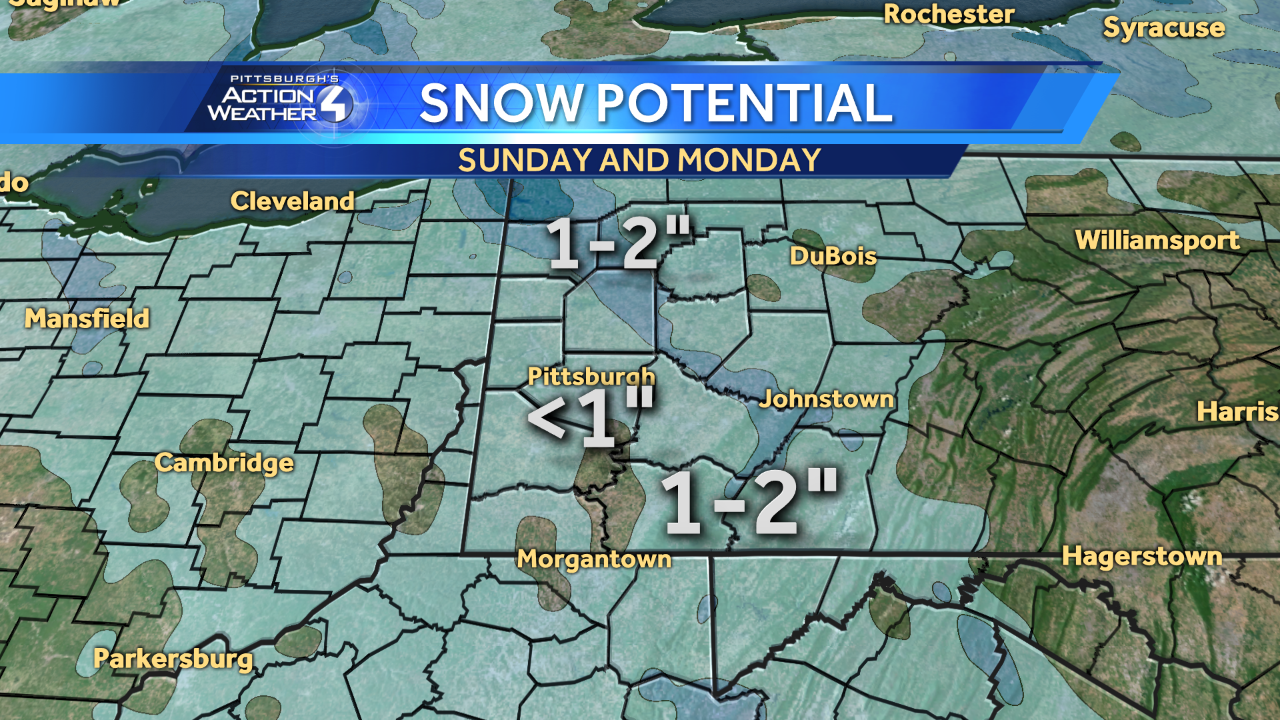
WTAE: Although this map comes from Saturday, it is the most recent one Channel 4 has posted online. It has some noticeable differences from its later Future Snow map (above) including the no-accumulation “snow hole” being further south and in Allegheny County. However, the general accumulation areas of C-1″ and 1-2″ remain the same.

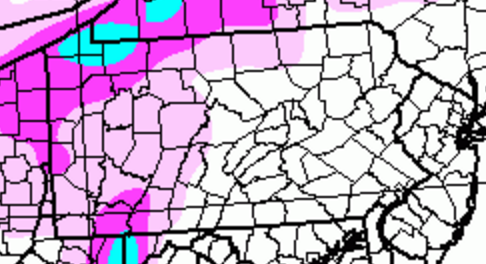
AccuWeather: This is the wackiest of the accumulation maps we have seen so far. AccuWeather typically overshoots reality with their maps, but in theory this map could prove to be true if you look at the low end of their ranges. However, encapsulating all of Western PA in a 1-3″ range is risky when nearly all other forecasts are calling for less than 1 inch. In addition, calling for up to 6″ in northwestern PA far exceeds any other forecast out there. AccuWeather frequently updates their maps to reflect their latest forecast data, so look for changes in this before the storm hits.
Intellicast: “The Authority in Expert Weather” uses computer models to automatically generate a forecast map. Although their forecast has much larger areas seeing no accumulation, it does follow the general shape being forecast and agrees with higher accumulations in the Erie area.
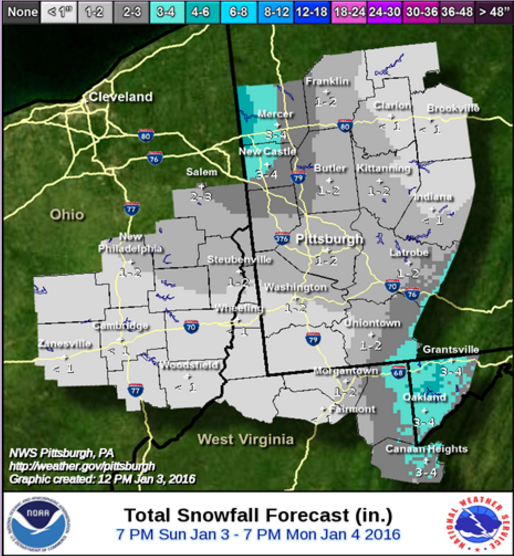
NWS: Rather surprisingly, the Pittsburgh office of the National Weather Service is calling for greater than 1″ of accumulation across the board. Their map follows the same sandwich shape as the others, but they count on a heavier pocket of 1-2″ impacting Allegheny county. There are also higher 3-4″ and 4+” areas much farther south than on other maps.
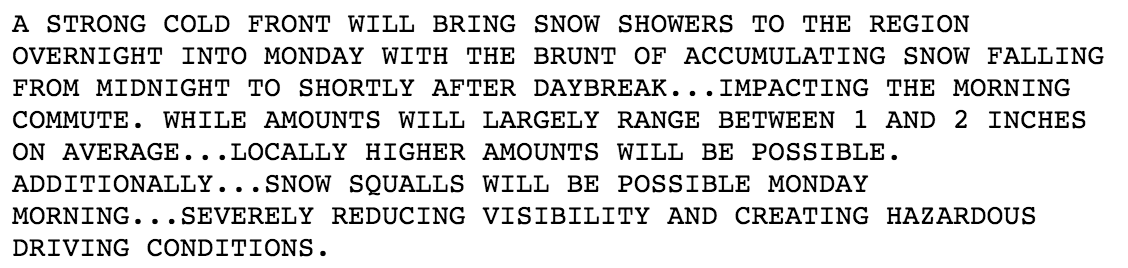
We also have their text forecast from the Hazardous Weather Outlook:
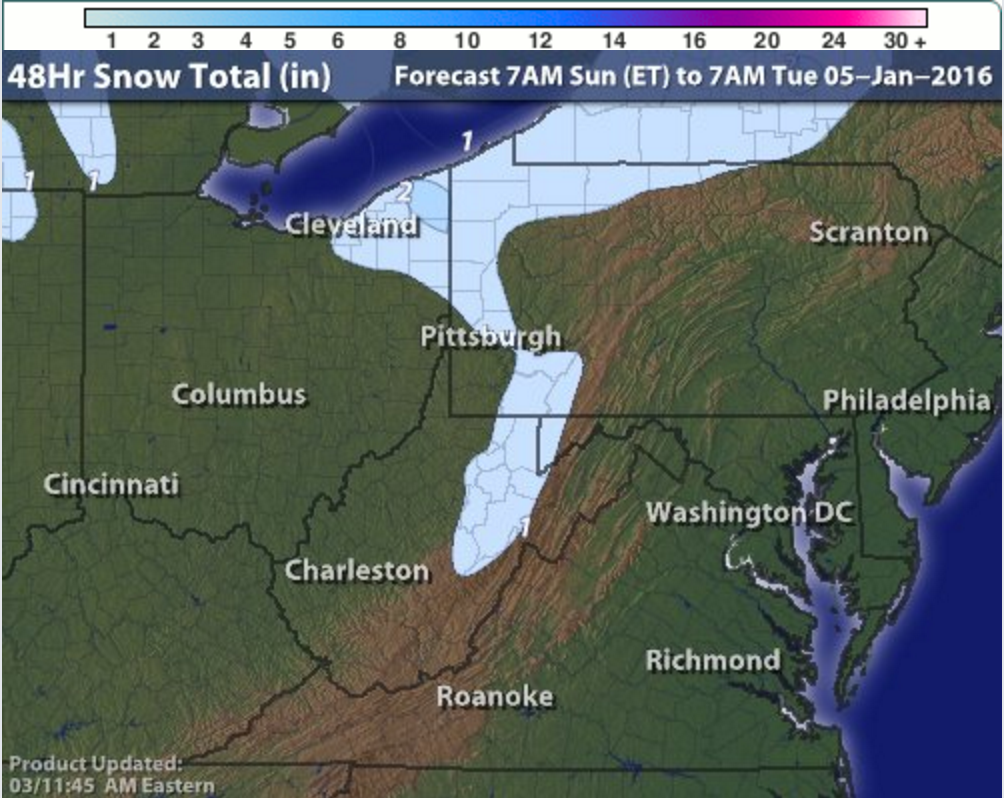
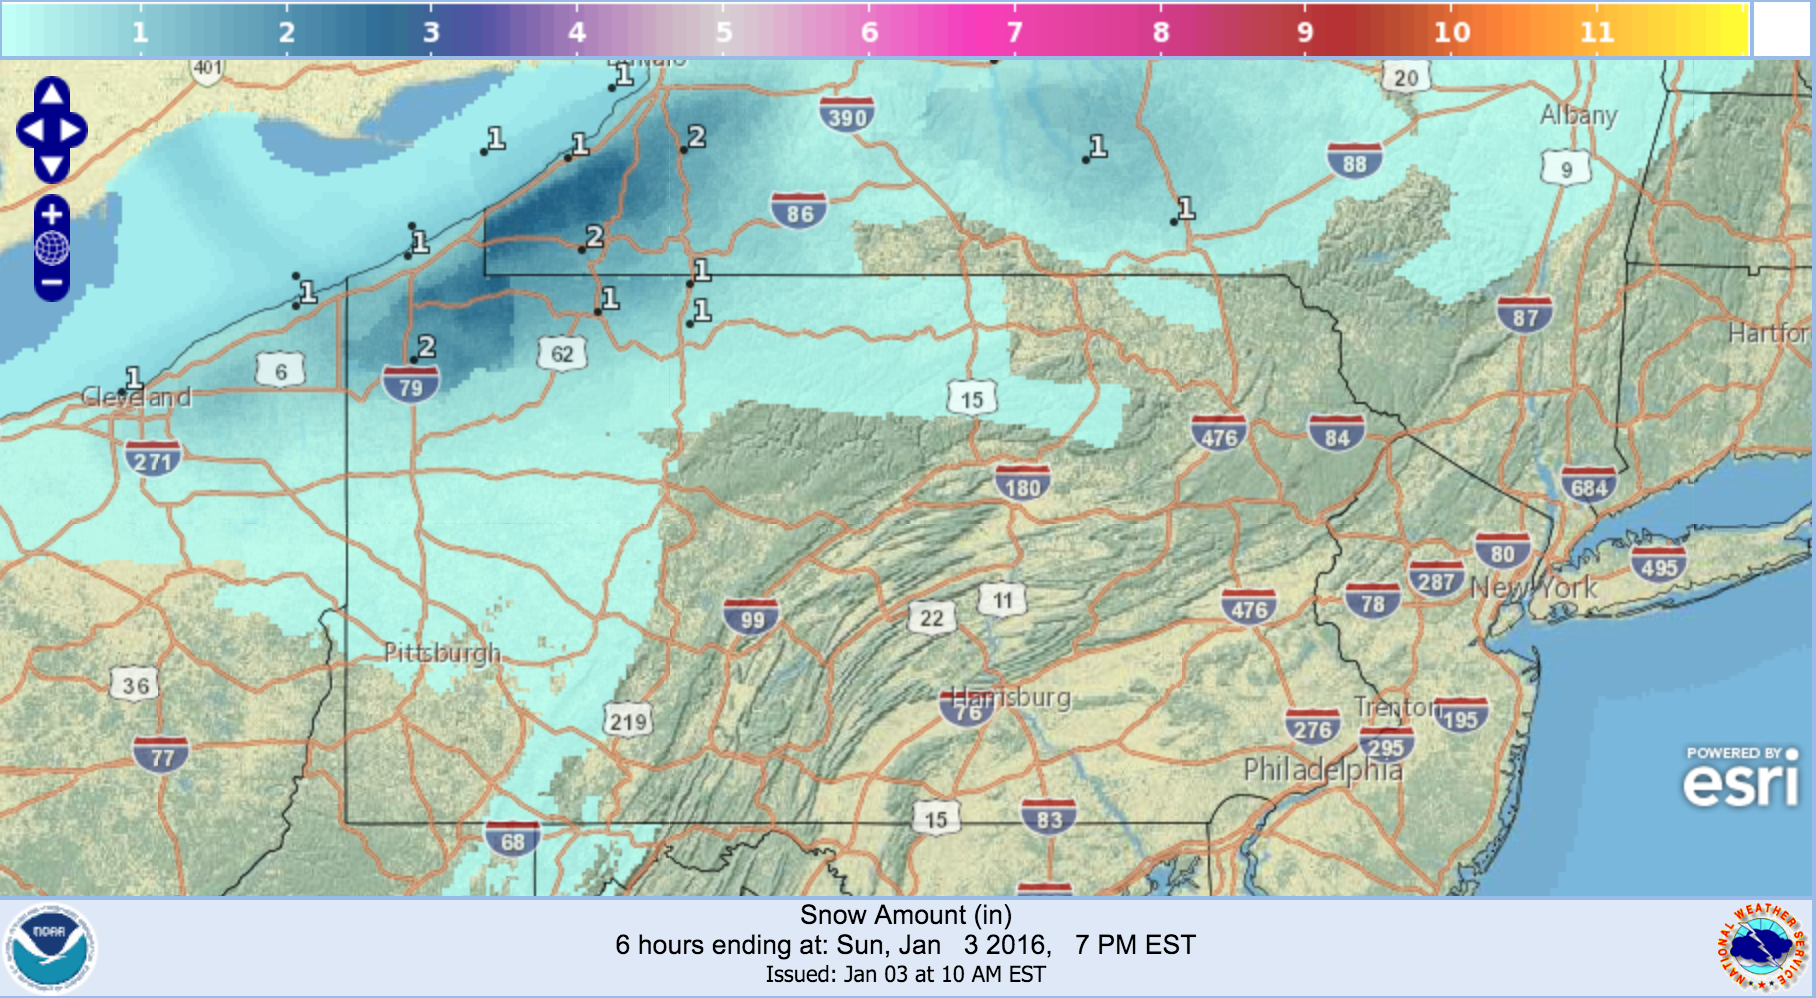
There is also the NWS’ national interactive snow map from digital.weather.gov, which reflects the general theme of everyone’s forecasts:
NOTES: KDKA has no mention of the storm on their website and no snow map is available. They are a partner with AccuWeather, so that is our best guess at what one of their maps may look like for now.
Be the first to comment on "Forecast Maps for January 4th snowfall"