Every time a snowfall is predicted, local and national media outlets will use various computer models to generate their accumulation forecasts. We will be saving and tracking these maps all winter long with a goal of determining which media network is the most reliable in predicting snowfall. Our commentary will describe the map’s successes and failures, then we will assign an Accuracy Score on a 0-10 whole number scale. We will average each agency’s Accuracy Score throughout the winter and keep an updated rankings list at the bottom of each Forecast Analysis post. Note: We at PGH Snow Day understand that forecasting the weather is hard. These posts are in no means intended to criticize incorrect predictions, but to find who regularly has the most reliable forecasts for snowfall.
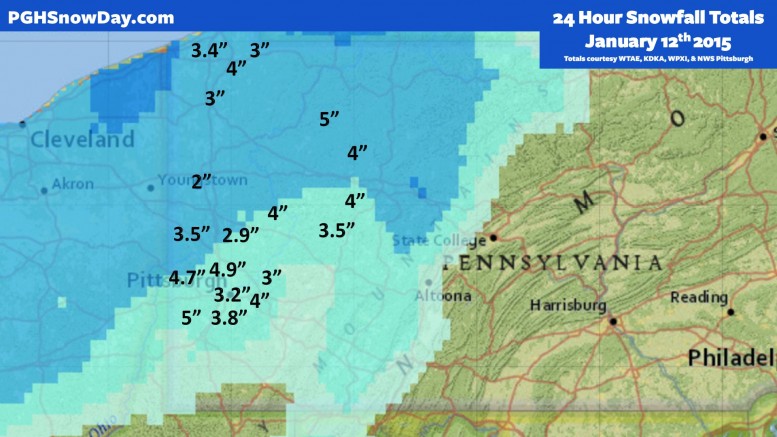
Our analysis will use official snowfall totals from the National Weather Service’s Pittsburgh Office, tweeted publicly at @NWSPittsburgh. These totals are subject to change, and if this is the case, we will come back and update our post. All currently available totals have been compiled on this map, with the background courtesy of the NWS’ Enhanced Data Display:

At quick glance, I worry about the success of any of the following maps because of the low totals reported from areas near the lakeshore. There also will be many predictions that undershot the 4.7″ official total for Pittsburgh.
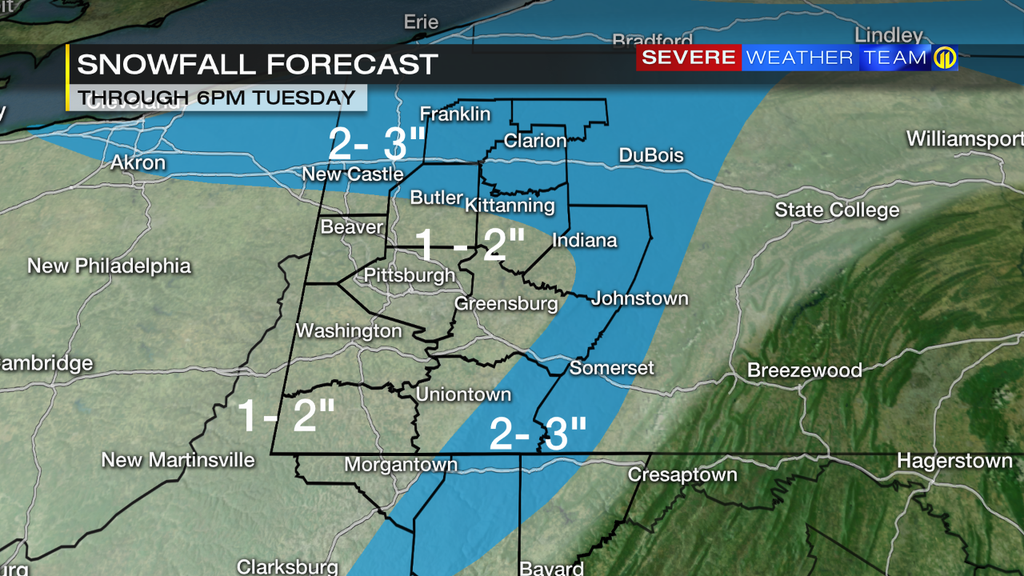
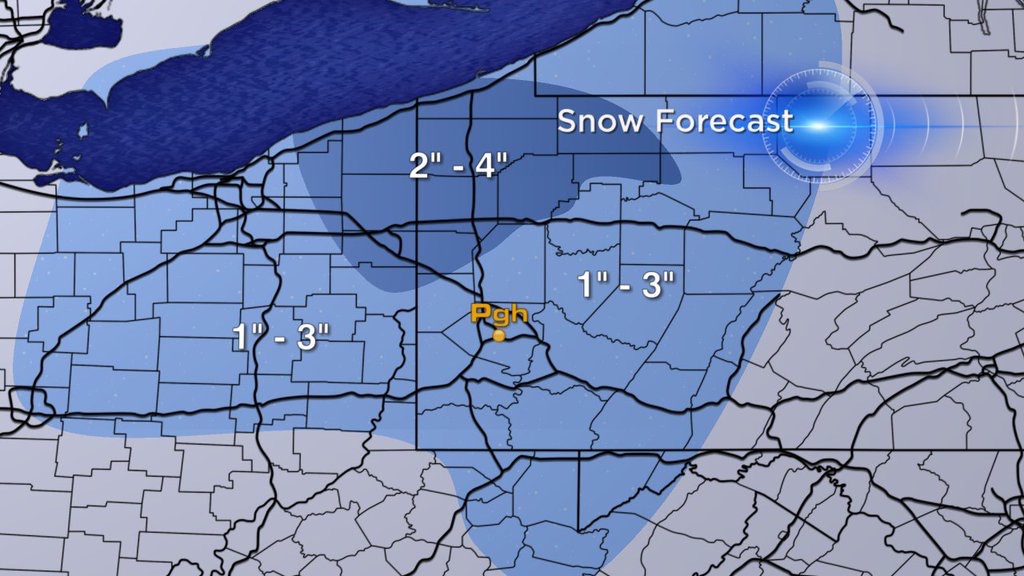
WPXI: Channel 11 undershot the total accumulations, specifically with areas in and around Allegheny County. Their 1-2 inch range for Pittsburgh ended up being wrong by 2.7″ at best. They also expected higher totals to be north and east of the city, but in reality some of the highest totals were in Allegheny County. Accuracy Score: 4
WPXI Futurecast: This map was part of Stephen Cropper’s evening newscast yesterday as WPXI’s take on the futurecast model, with more precise areas of accumulation. It also undershot many of the predictions, including Allegheny County once again in a 1-2 inch range. However, some props can be given for the 3-4 inch totals in the northern parts of the state which were in line with the received reports. Accuracy Score: 4
WTAE: This map was really wrong. It predicted that potentially all of the region could see just one inch, whereas in reality the smallest accumulation recorded was 2″ in New Castle. The shading of this map expected the higher numbers to be north and east of Allegheny County, which, as we said earlier, proved to be incorrect. Like WPXI, WTAE was 2.7″ off at best. Accuracy Score: 3

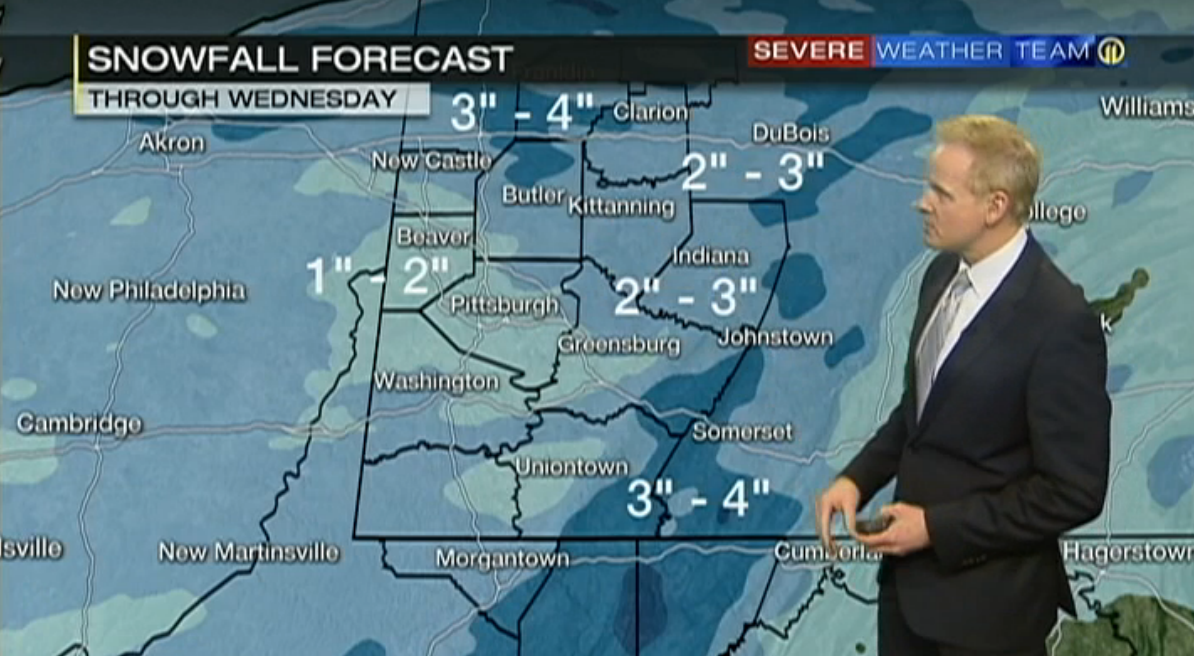
WTAE FutureCast: Some areas of this map are spot on, and others are way off. We were a little disappointed while analyzing this one, because WTAE FutureCast has historically been very reliable in predicting snowfall. Unlike WPXI’s future map, WTAE provides specific numbers on their map, which we applaud them for. Some predictions to point out: New Castle 1.9″ (Official 2″), Clarion 3.6″ (Official 4″), Pittsburgh 1.4″ (Official 4.7″), Washington 1.6″ (Official 5″). Accuracy Score: 4
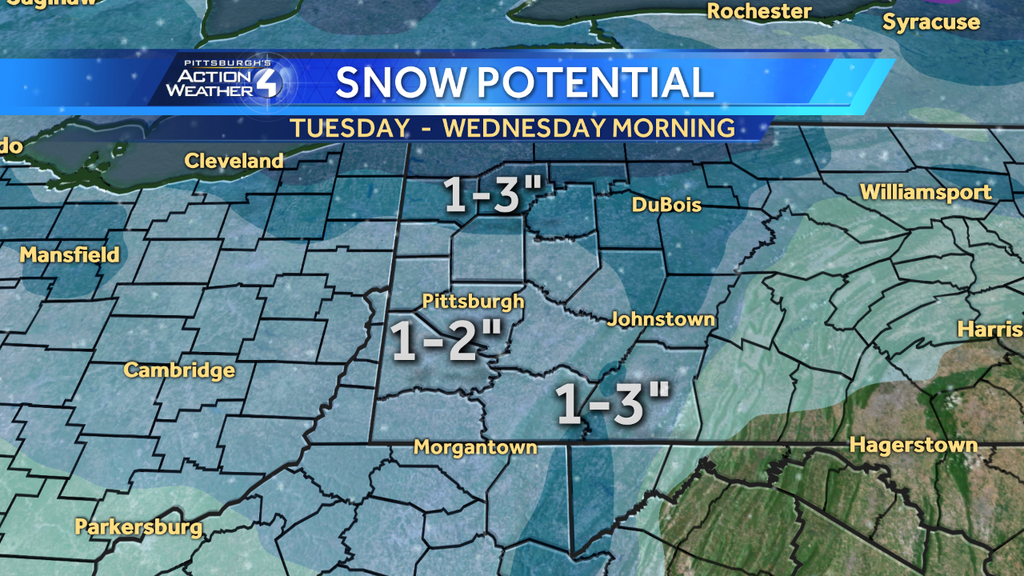
KDKA: CBS Pittsburgh did not post a snow map for the last storm on Jan. 4th, so this will be their first evaluation of the season. This is a rough start for them. Like so many other networks, KDKA thought the heaviest totals would be in northern PA by Lake Erie. Although their larger range that allowed up to 3 inches was a good decision, it still was not large enough to include the 4-5 inch totals we saw in saw many areas. Although their numbers up north were correct, their guess that those would be the biggest was incorrect. Unlike WTAE and WPXI, KDKA was off by 1.7″ at best because of their larger range, which does earn them some praise. Accuracy Score: 5
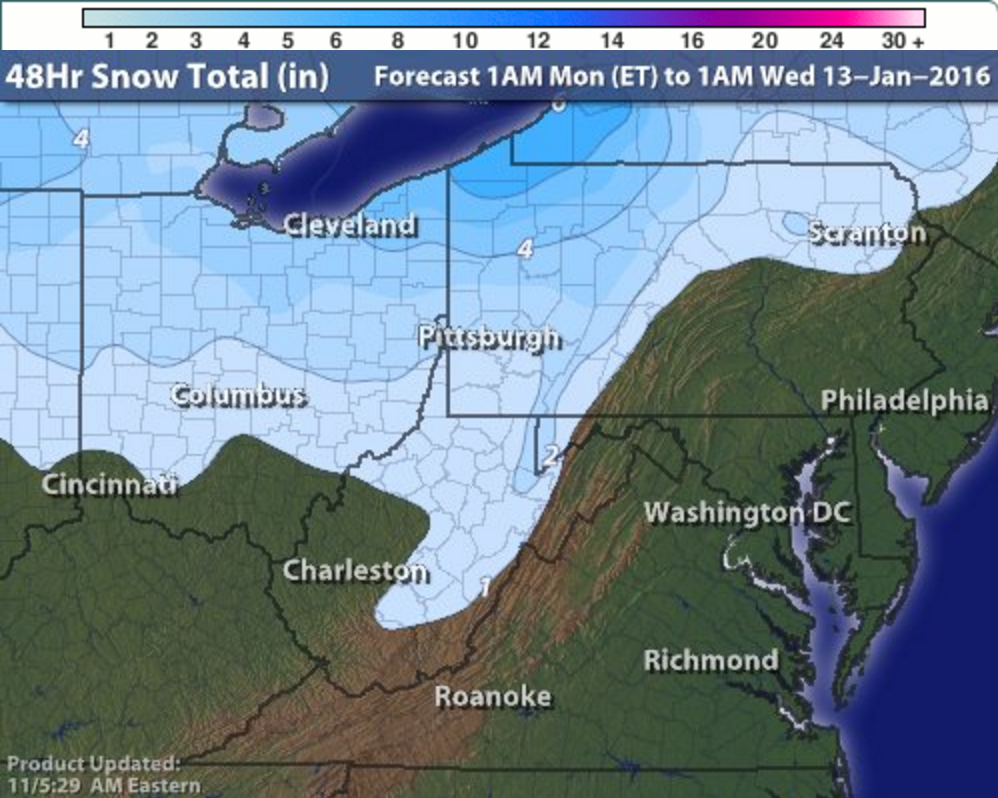
Intellicast: This map is followed a true lake-enhanced squall pattern, as the further south you are, the less accumulation you were forecast to see. Unfortunately, that was not how this storm worked at all. Their 1-2 inch boundary went right through Pittsburgh, which actually saw 4.7 inches. They too predicted higher totals off the lake, with a projected 6 inches for Erie on this map, which actually saw 3.4″. There is not much correct about this map. Accuracy Score: 2
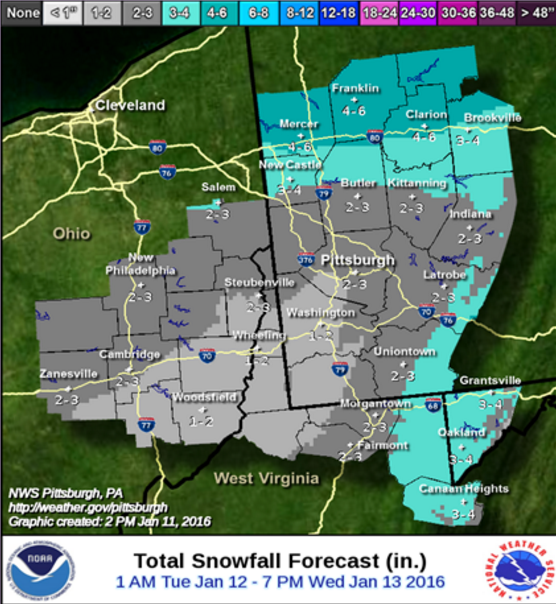
NWS Pittsburgh: Much like the maps before it, the NWS thought the biggest accumulation reports would come from the northern portions of their forecast region as well as the Laurel Ridges. They deserve praise for removing most of Allegheny County from a 1″ potential, instead option for 2-3 inches. Although this ended up being too low, it still was among the highest forecasted amounts for the city. They nailed some forecast areas like Clarion, but unnecessarily predicted that areas to the southwest of Pittsburgh would see no more than 2 inches. Accuracy Score: 5

NWS National: This is a disaster of a forecast. Accuracy Score: 0
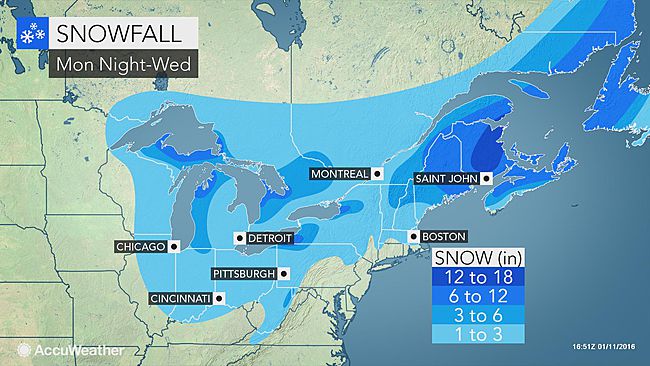
AccuWeather did the best job of predicting that most of western Pennsylvania would see generally the same amount. However, their predicted snowfall range of 1-3 inches was too low. In addition, they too fell trap to thinking the towns right on the shores of Lake Erie would see heavy amounts of up to a foot. Accuracy Score: 4
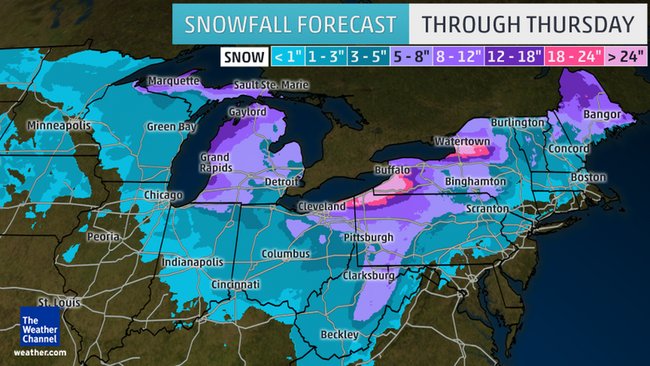
The Weather Channel: This map was very puzzling when we first saw it, and it certainly has some big problems. For example, there clearly are light pink areas in northern PA that called for over two feet of snow. In reality, Erie saw barely more than 3 inches. However, The Weather Channel did the best job of predicting the higher snowfall amounts, specifically in Allegheny County. Pittsburgh is placed right on the border of the 3-5″ and 5-8″ ranges, which is spot on. Unfortunately, being wrong by 20″ up north was a huge mistake. Accuracy Score: 5
Leave a comment