Every time a snowfall is predicted, local and national media outlets will use various computer models to generate their accumulation forecasts. We will be saving and tracking these maps all winter long with a goal of determining which media network is the most reliable in predicting snowfall. Our commentary will describe the map’s successes and failures, then we will assign an Accuracy Score on a 0-10 whole number scale. We will average each agency’s Accuracy Score throughout the winter and keep an updated rankings list at the bottom of each Forecast Analysis post. It is important to note before we get into the post that this analysis is for Western Pennsylvania. Many of these maps also have predictions for many other parts of the Mid Atlantic and Northeast, but know our discussion is only referring to the areas around Pittsburgh.
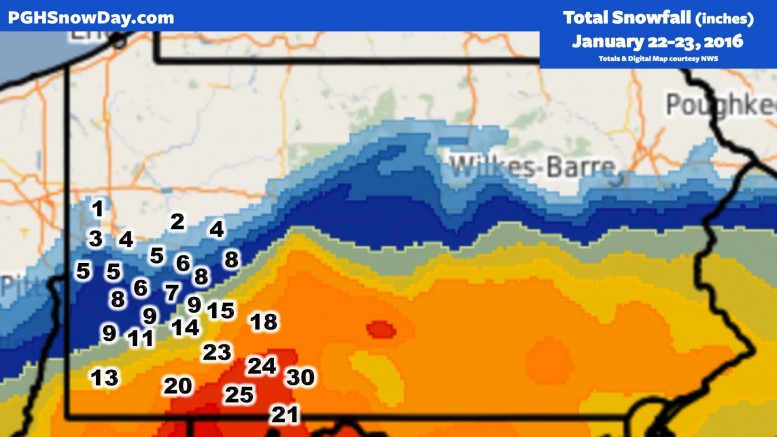
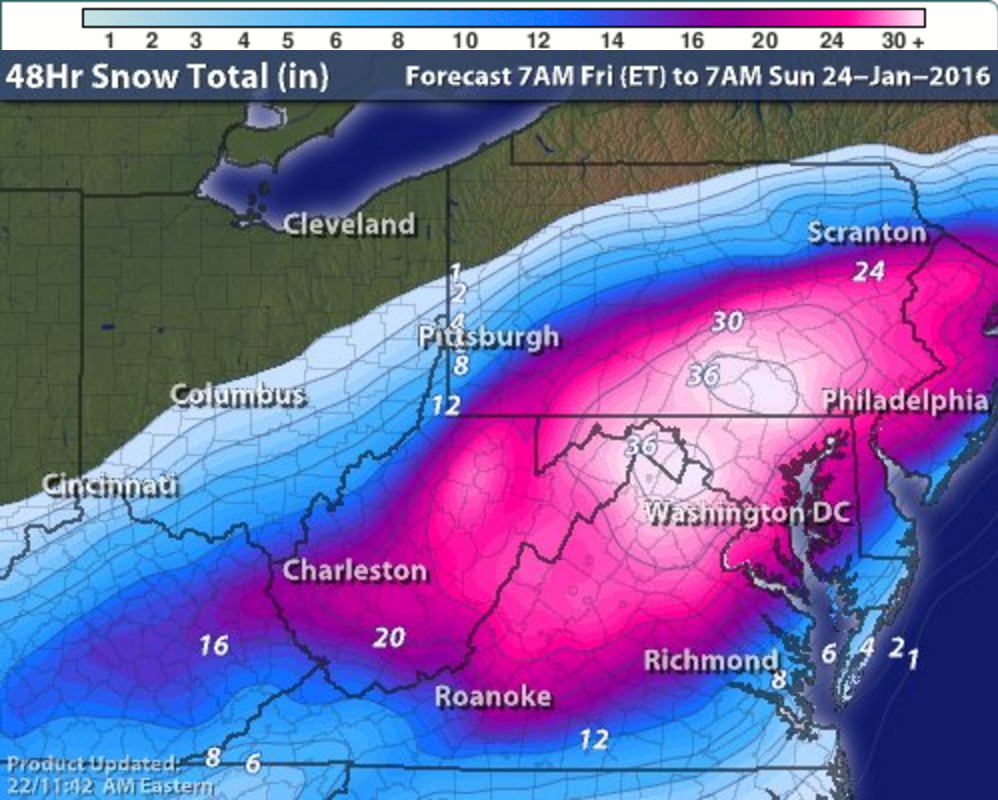
Our analysis will use official snowfall totals from the National Weather Service’s Pittsburgh Office, tweeted publicly at @NWSPittsburgh. This post would not be possible without the hard work and dedication of the NWS Pittsburgh office, which worked through the night to compile hundreds of snowfall reports. All currently available totals have been placed on the following map, with the background courtesy of the NWS’ Enhanced Data Display. NWS Pittsburgh Official Total: 4.9″

All of our analysis articles include a disclaimer, but we felt for this storm it was important to dedicate a whole paragraph to it. We at PGH Snow Day understand that forecasting the weather is hard. In particular, this storm has been an absolute bear to forecast in a huge area, but specifically the Western Pennsylvania forecast has been very tricky. Forecasting models flipped and flopped north and south all week long, and we had little idea if the city would see just a dusting or a foot of snow. This post is in no means intended to criticize incorrect predictions, but instead to allow us to see who has the most reliable forecasts over the entire winter.
NOTE: Many of the media outlets included in this post changed their maps during the storm to make their viewers better aware of what to expect. However, we cut off changes in our Forecast Roundup at noon on Friday, which are the same maps included in this post. These were the most recently updated maps just before the snow began to fall lunchtime on Friday.
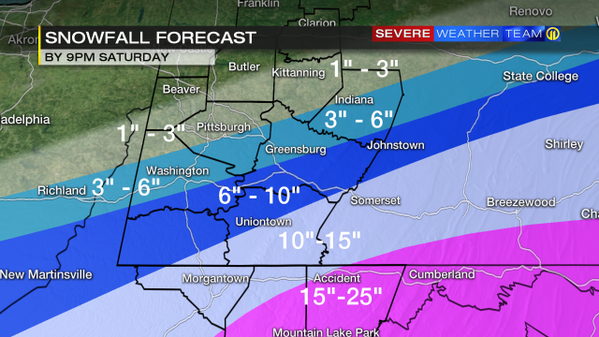
WPXI: Channel 11 was one of the networks that became aware of a more forceful northern push once the system made its way into the area. In this map from noon Friday, they put the 1-3 inch cutoff line right through the city of Pittsburgh. Since the city officially saw almost 5″, this makes their prediction off by at least 2″. Their southern Allegheny County predictions were more in line with reality, but the totals in southern PA far exceeded their 10-15 inch range. Accuracy Score: 4/10
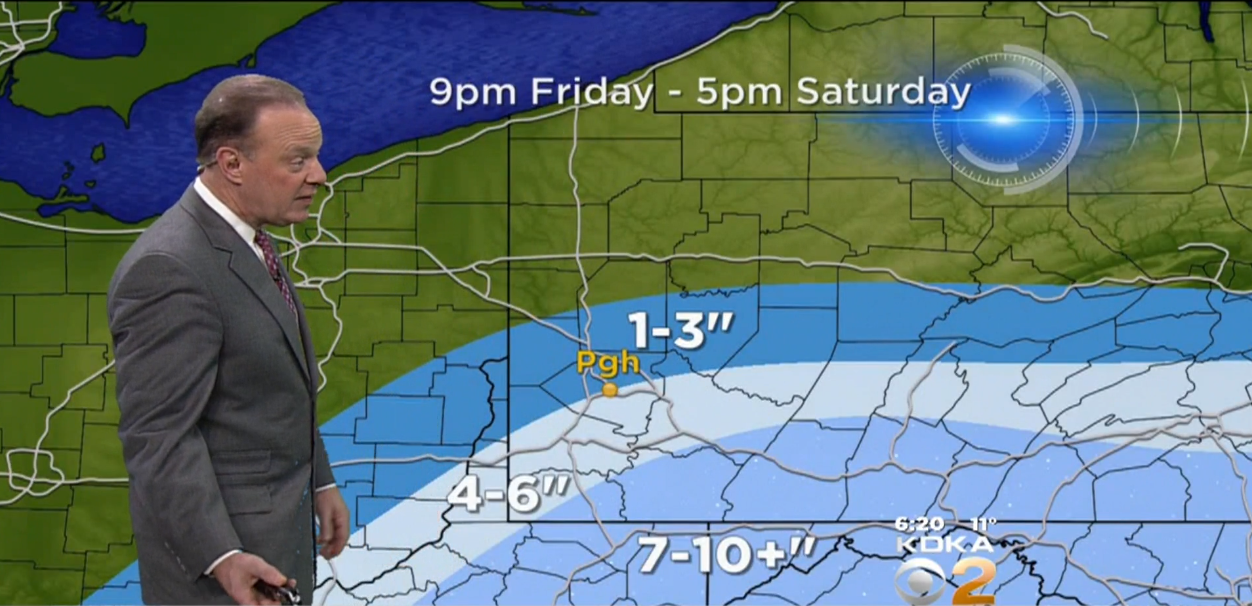
WTAE: Pittsburgh’s Action Weather elected to use many thin bands, rather than larger broad-ranged ones. They nailed the official NWS total from Moon Township, having 4.9″ fit perfectly into a 3-6 inch range. Their purple shadings were pretty close, but like WPXI, they undershot the 20+ inch totals that were recorded in southern PA. Accuracy Score: 7/10
KDKA: The team at KDKA stood strong all week and refused to let the swaying models impact their forecast. They were among the first to publish an accumulation prediction map during the 4:00 news on Wednesday, and we really liked their initial thoughts. Over the next three days, the only change made to their map was an increase of the 4-6 inch range, which originally was 3-5 inches. Just like WPXI, KDKA drew their boundary line right through the city, which proved to be too far south. Their 4-6 inch range was also too far south, as storm reports of 9+ inches came in from this area. Like their two local competitors, KDKA also far undershot the totals in southern PA. Accuracy Score: 3/10
Intellicast: The map from Intellicast demonstrated just how ridiculously thin the accumulation gradient was for this system. The remarkable cutoff of accumulation made forecasting for specific locations so difficult. Intellicast had a rough time predicting the last snowfall, which was disappointing because it has been one of our favorites over the past few winters. Fortunately, it did super for this storm. A range of 4-12 stretched from tip to tip of Allegheny County, and that ended up being pretty close. Their 4-6″ line through the center of the county was very close to the official 5″ in Pittsburgh, and their 12″ line matches up very well with the collected reports. In addition, they correctly forecasted the heavy 16+ inch totals towards the PA/WV/MD borders. If there’s something to complain about here, its that their accumulations may have been a bit too far north. Accuracy Score: 9/10
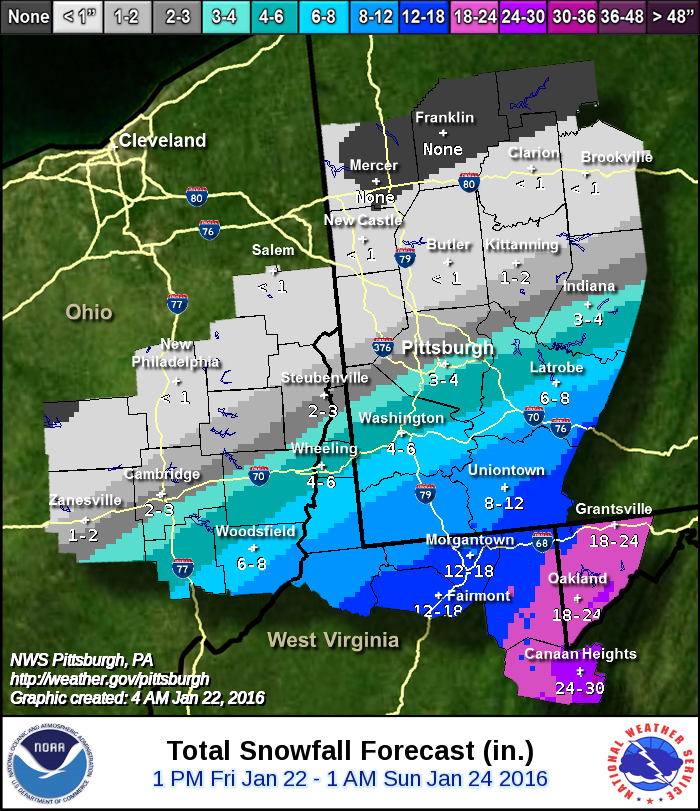
NWS Pittsburgh: The National Weather Service did a phenomenal job of keeping everyone updated and refreshing weather alerts throughout the storm. Unfortunately, their snow map was off. They called for a range of 2-3″ at their Moon office, well short of the 4.9″ they saw. Only the extreme southern tip of Allegheny County was marked at 6-8 inches, which ended up being spot on. However, like many others, they undershot totals further south, but were among the closest to being right. They nailed the extreme thinness of the accumulation gradient, but underestimated just how much snow could fall north. Accuracy Score: 4/10

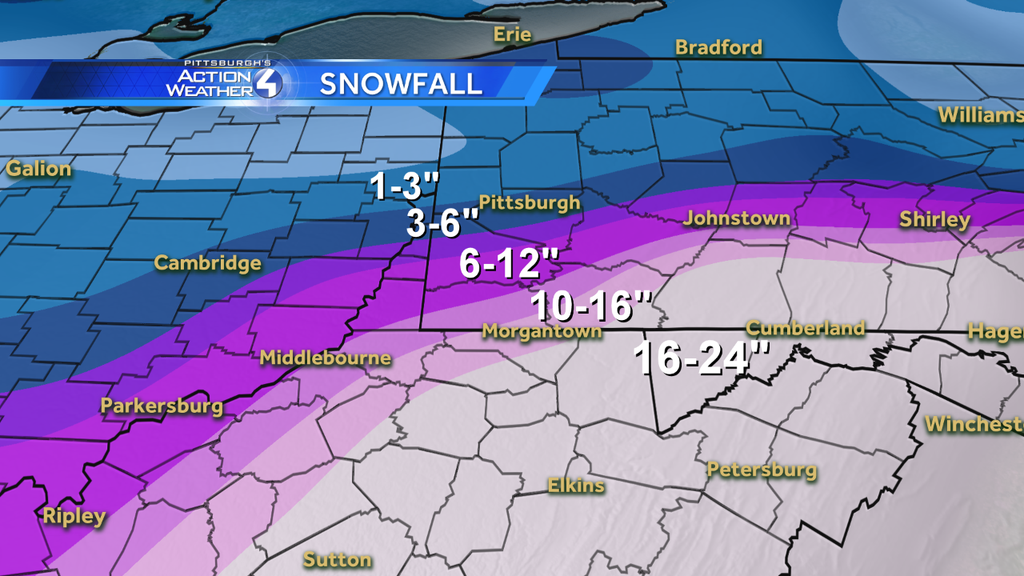
NWS Digital: Last snowfall, this model was disastrously wrong, but this storm it seemed to be better in line with everyone else. It did undershoot the accumulations just about everywhere, but it nailed the placement of the northern boundary. Putting this shading on top of the snowfall total map at the top of this post, the shape is almost exactly right. However, as we mentioned, the totals were not close. The 4″ boundary was well south of Pittsburgh, which as we know ended up being north of the city. This model also predicted totals that were far too low for southern PA. Accuracy Score: 4/10
AccuWeather: The digital weather giant AccuWeather was among the first to publish an accumulation map for this storm, and although numerous changes were made to it in the high snowfall areas, the ranges in western Pennsylvania never changed. This proved to be costly to the accuracy of their forecast, which put the boundary between no snow and 1-3″ right through the city. Accumulating snows were seen north of Pittsburgh, making this map too far south from the beginning. Remarkably, their 3-6″ range stretched all the way south into West Virginia and extreme souther PA, which was way off. Totals of more than 20″ fell in areas that they forecasted to be less than 6″. Accuracy Score: 1/10
The Weather Channel: The “Weather Giant” was the first to issue a snow map for the storm they’ve named Jonas, and they wrestled with the northern extent of the storm many times. Earlier in the week, they thought Pittsburgh may not see any accumulation at all, but thankfully they brought their boundaries further north. Alas, they were still too far south. If the cities were labeled on this map, Pittsburgh would be on the boundary between 1-3 and 3-5 inches. Thus, with a 4.9″ total, TWC undershot the totals. Unlike every other map on this page, TWC did accurately bring the 18+ inch range up into southern PA. Had they shifted their map further north, it would have been almost perfect. Accuracy Score: 5/10
Here’s an updated look at the Accuracy Score rankings:
Be the first to comment on "Forecast Analysis of Jan. 22-23 Snowfall"