Welcome to our first forecast analysis of the winter season. Every time a snowfall is predicted, local and national media outlets will use various computer models to generate their accumulation forecasts. We will be saving and tracking these maps all winter long with a goal of determining which media network is the most reliable in predicting snowfall. Our commentary will describe the map’s successes and failures, then we will assign an Accuracy Score on a 0-10 whole number scale. We will average each agency’s Accuracy Score throughout the winter and keep an updated rankings list at the bottom of each Forecast Analysis post.
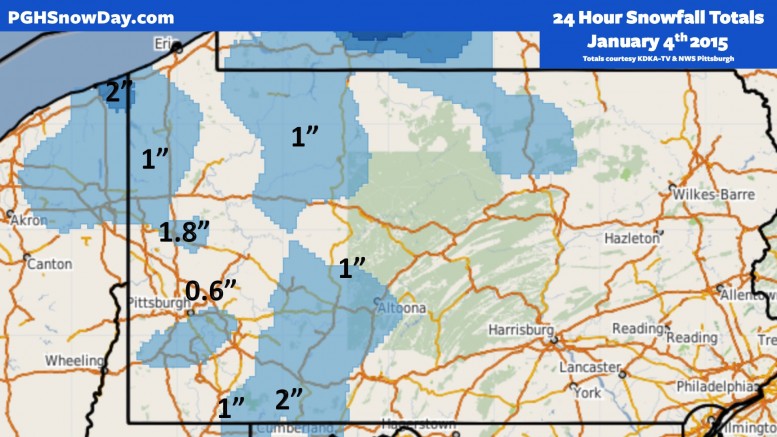
Our analysis will use official snowfall totals from the National Weather Service’s Pittsburgh Office, tweeted publicly at @NWSPittsburgh. These totals are subject to change, and if this is the case, we will come back and update our post. In this case, we have also included snow totals reported by KDKA-TV on the noon newscast. All currently available totals have been compiled on this map:
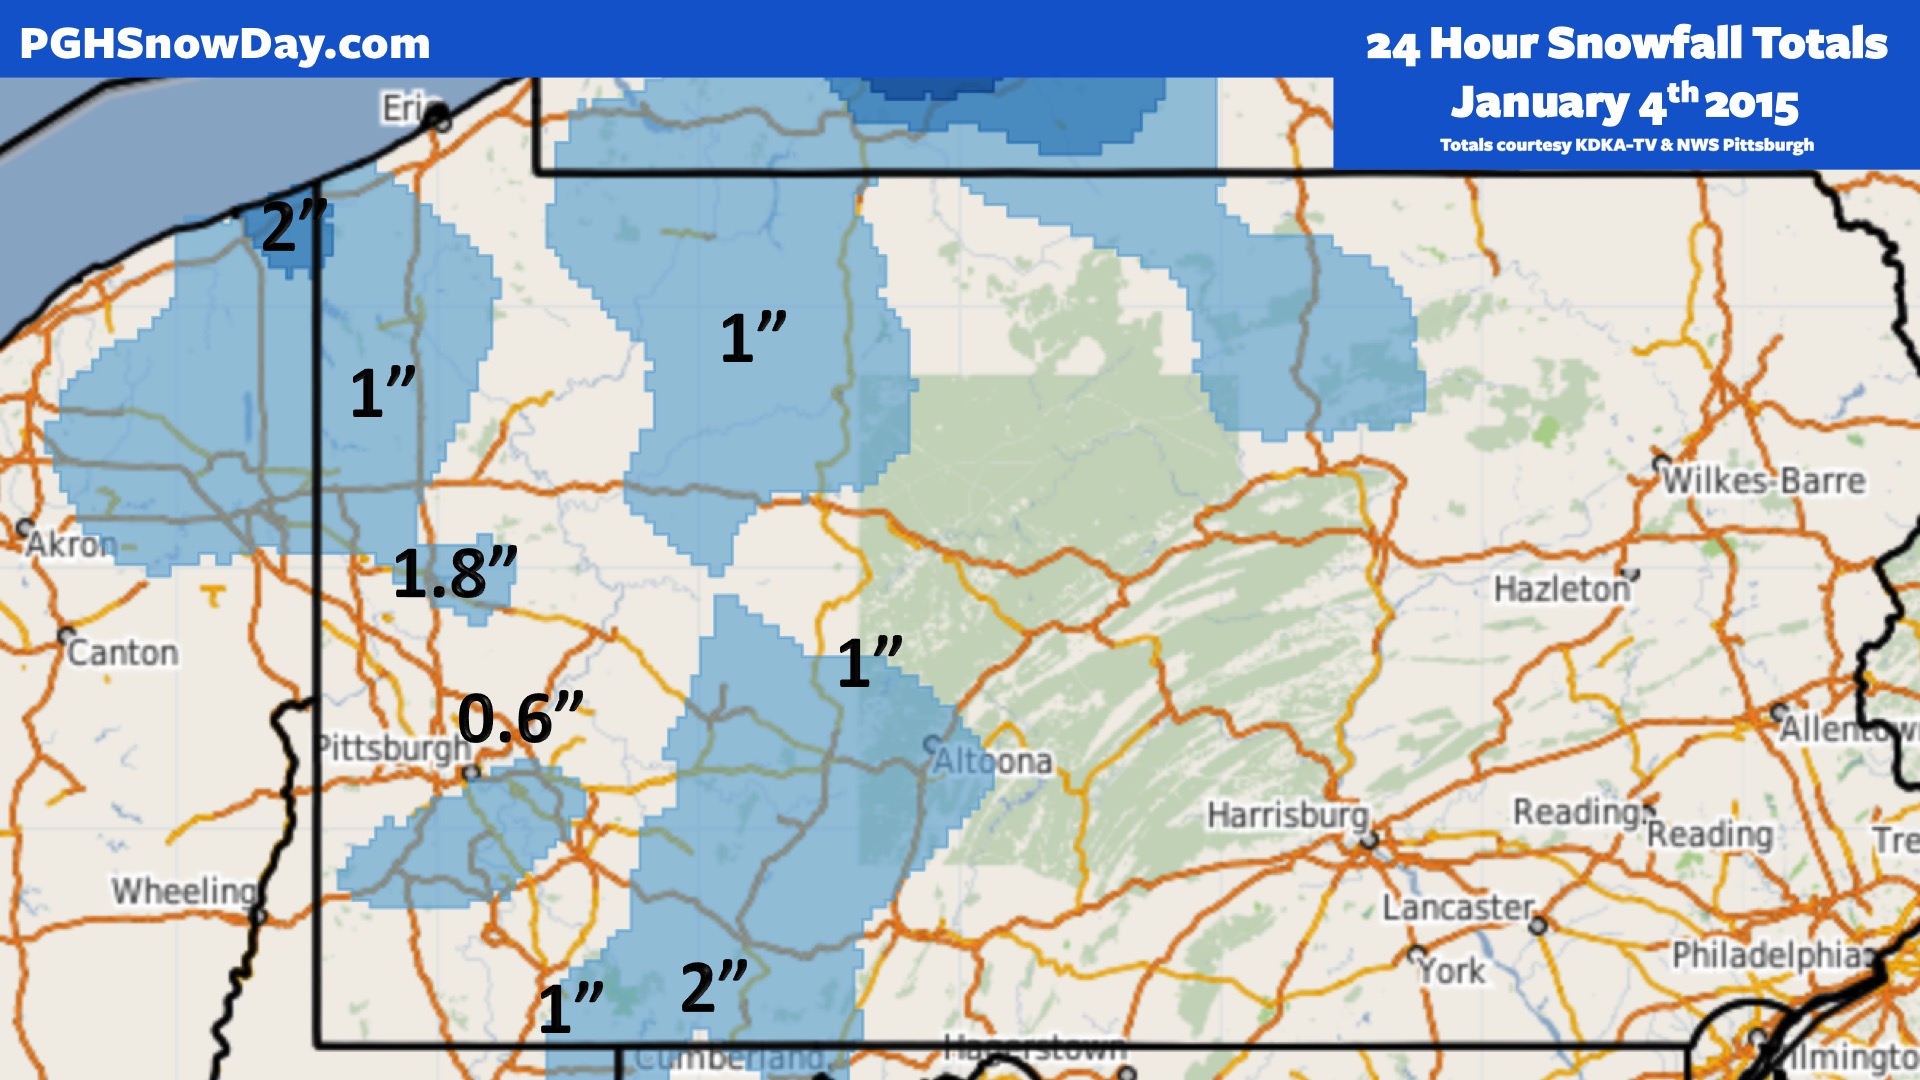
The key number on this map is the 0.6″ in Pittsburgh, which will be recorded as the storm total by the NWS. However, it is still possible for this number to change. On twitter, the NWS confirmed this is the total since midnight, so there is a chance for some additional accumulation to be added to this number from Sunday evening.
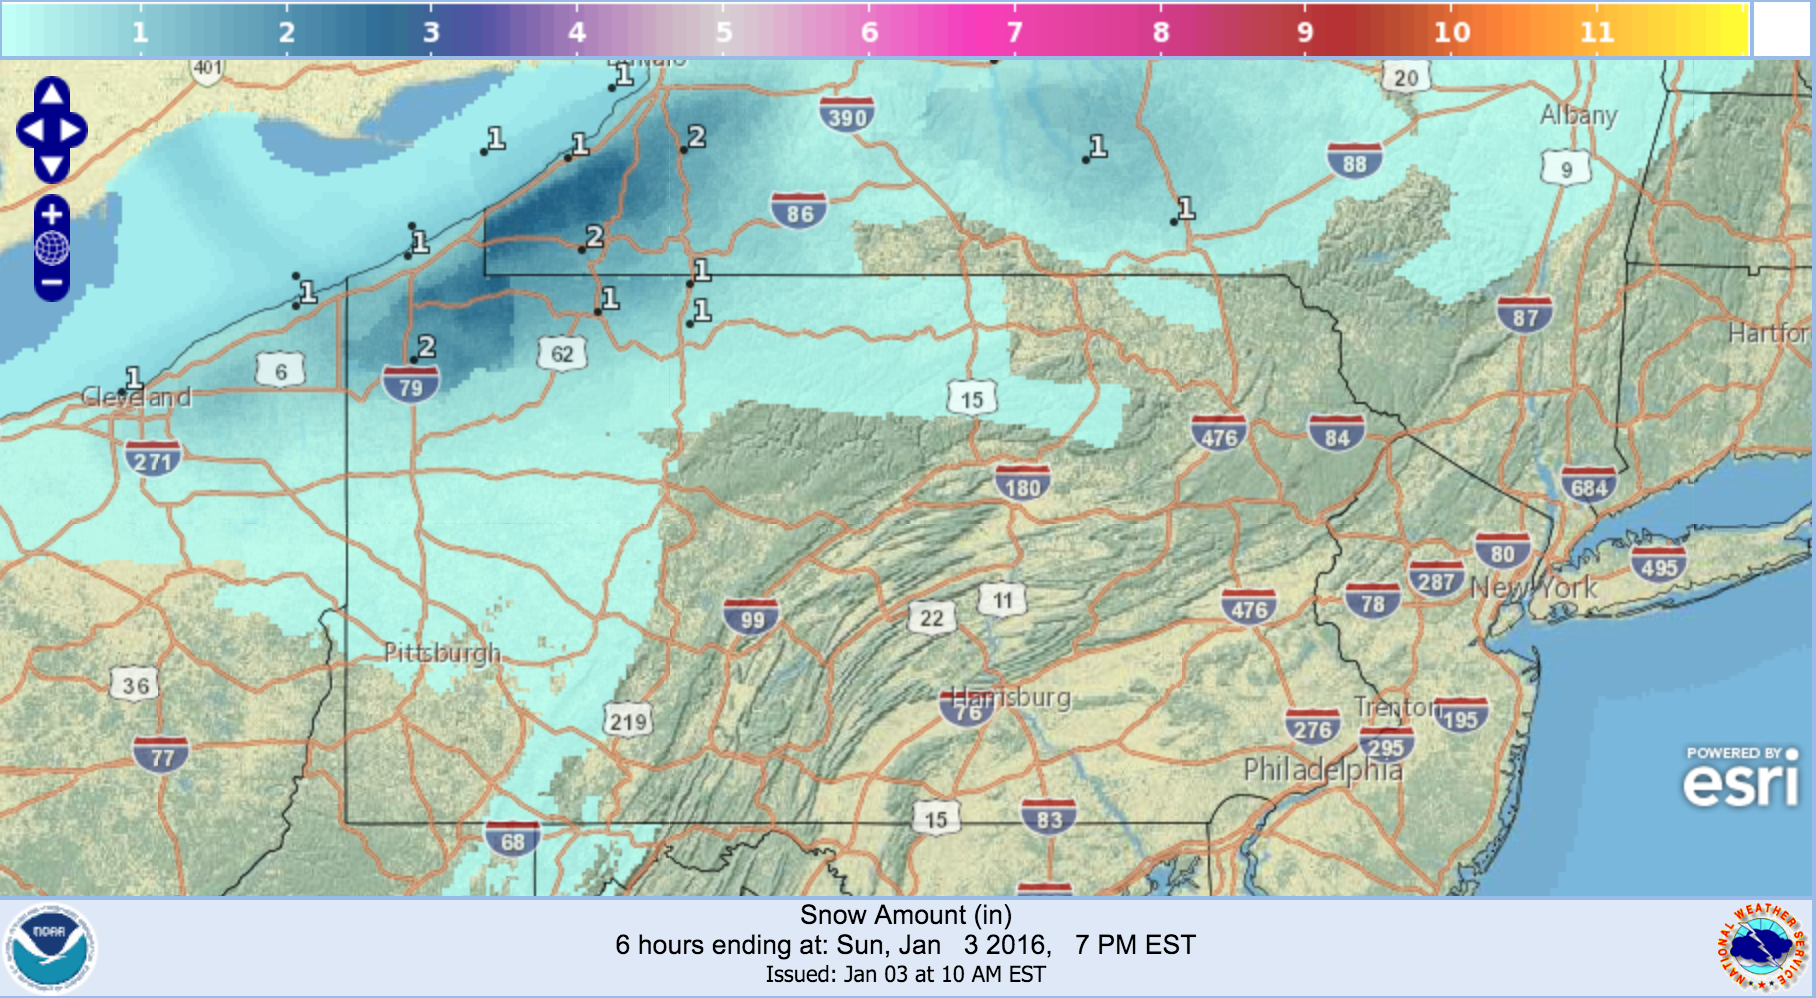
Now that we have the totals, we are able to compare the above map (courtesy of the NWS’ Snowfall Analysis Tool) to the forecast maps published here yesterday.

WPXI: Severe Weather Team 11 more or less got this one right. They nailed the general shape of the accumulation spread, leaving a hole around much of Western PA and Allegheny County. Unless the NWS totals change, there are none conflicting with WPXI’s predictions. Accuracy Score: 10
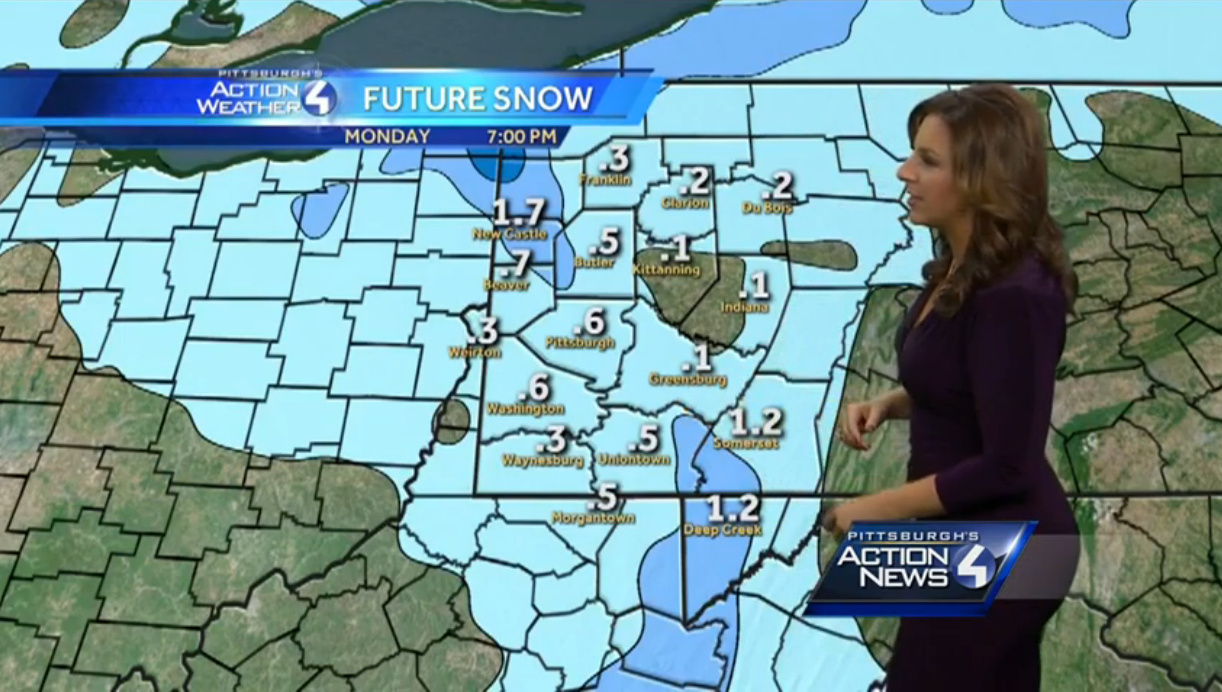
WTAE: As our Forecats Roundup article from yesterday mentioned, Pittsburgh’s Action Weather has two methods of making accumulation forecasts. This one, based on their futurecast model, runs the length of the storm while giving “future snow” totals. In past years, this has been a highly accurate model and this storm is no exception. This graphic, made Sunday morning, is almost entirely spot on. It got Pittsburgh’s 0.6″ total exactly right, and almost nailed Saxonburg’s 1.8″ total with a forecast of 1.7″. There is however an issue with an “accumulation hole” to the northeast of Allegheny county, where totals ranged anywhere from 0.5″ to 1″. It also could have used a bit higher totals along the PA/WV border. Accuracy Score: 9
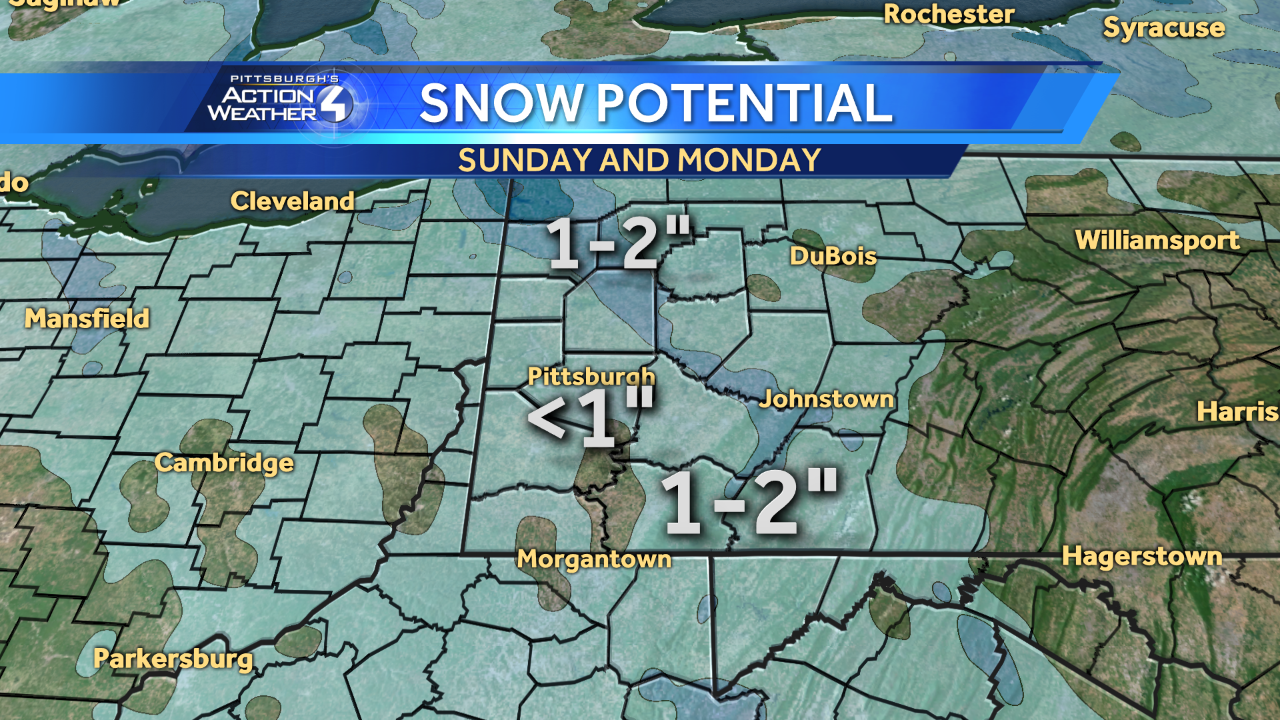
WTAE: Unlike the WTAE FutureCast graphic above, this modified version is a typical snowmap. Its broader total predictions allow for a more general prediction of the storm, and this one got it right. Just like WPXI’s graphic, WTAE got the general shape of the accumulation distribution right. Although the coloring of the map shows holes with no accumulation, their label simply says less than 1″, which is correct so far based on available totals. Accuracy Score: 9

AccuWeather: This was the wackiest of the accumulation maps we analyzed. AccuWeather typically overshoots reality with their maps, and this was no exception. By calling for 1-3 across the board, AccuWeather set themselves up for failure with many areas seeing traces of snow rather than a full inch. More troubling is the pocket of 6-12 inches off the shore of Lake Erie, where totals thus far are recording just 2″. In addition, their swath of 3-6 inches stretched further south than other maps, which was also wrong. Although the shape was half-right and the totals almost reached an inch, the AccuWeather map falls far short of its competitors. Accuracy Score: 5
Intellicast: It is hard to precisely analyze the Intellicast.com map because it uses broad ranges and does not account for traces of accumulation. With that said, it got the 2″ right off the shore of Lake Erie, but failed to extend that range into Pennsylvania over the Ohio border. It has the correct general shape with higher totals off the lake and in the mountains, but it misses some 1″ totals to the northeast of Allegheny county. Accuracy Score: 7
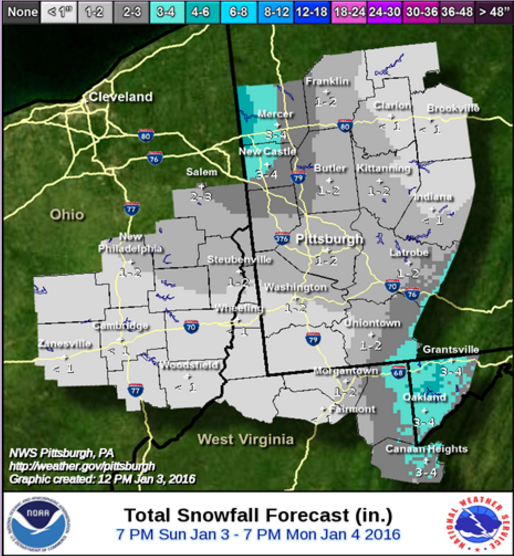
NWS: We were surprised when the Pittsburgh office of the National Weather Service called for greater than 1″ of accumulation across the board. Their map followed the same sandwich shape as the others, but it called for excess accumulation, similar to AccuWeather. Their 1″ to 2″ pocket that stretched from Kittanning to Washington was more like a coating to an inch in reality, and as of now no totals of 3-4″ as far south as New Castle have been reported. On top of that, their heavy accumulations of 3″+ in northern Maryland and extreme southern PA are too high when looking at the currently reported totals. Accuracy Score: 6
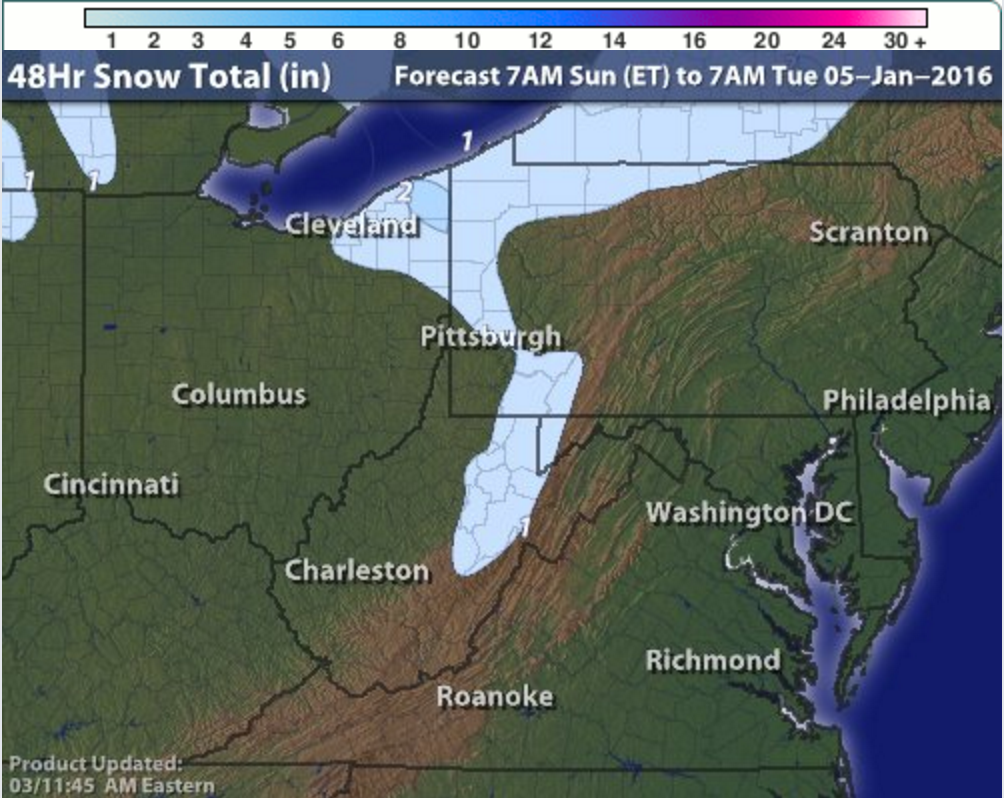
There was also the NWS’ national interactive snow map from digital.weather.gov, which reflected the general shape of the accumulation spread. It did correctly predict just 2″ in the northern PA handle, and was correct in tapering off accumulations just south of Pittsburgh. In general, this is a good map that did not overshoot the predictions and kept the “for sure” numbers of 1 inch or more to the north. Accuracy Score: 9
NOTES: KDKA never mentioned the storm on their website and no snow map was ever made available.
Leave a comment